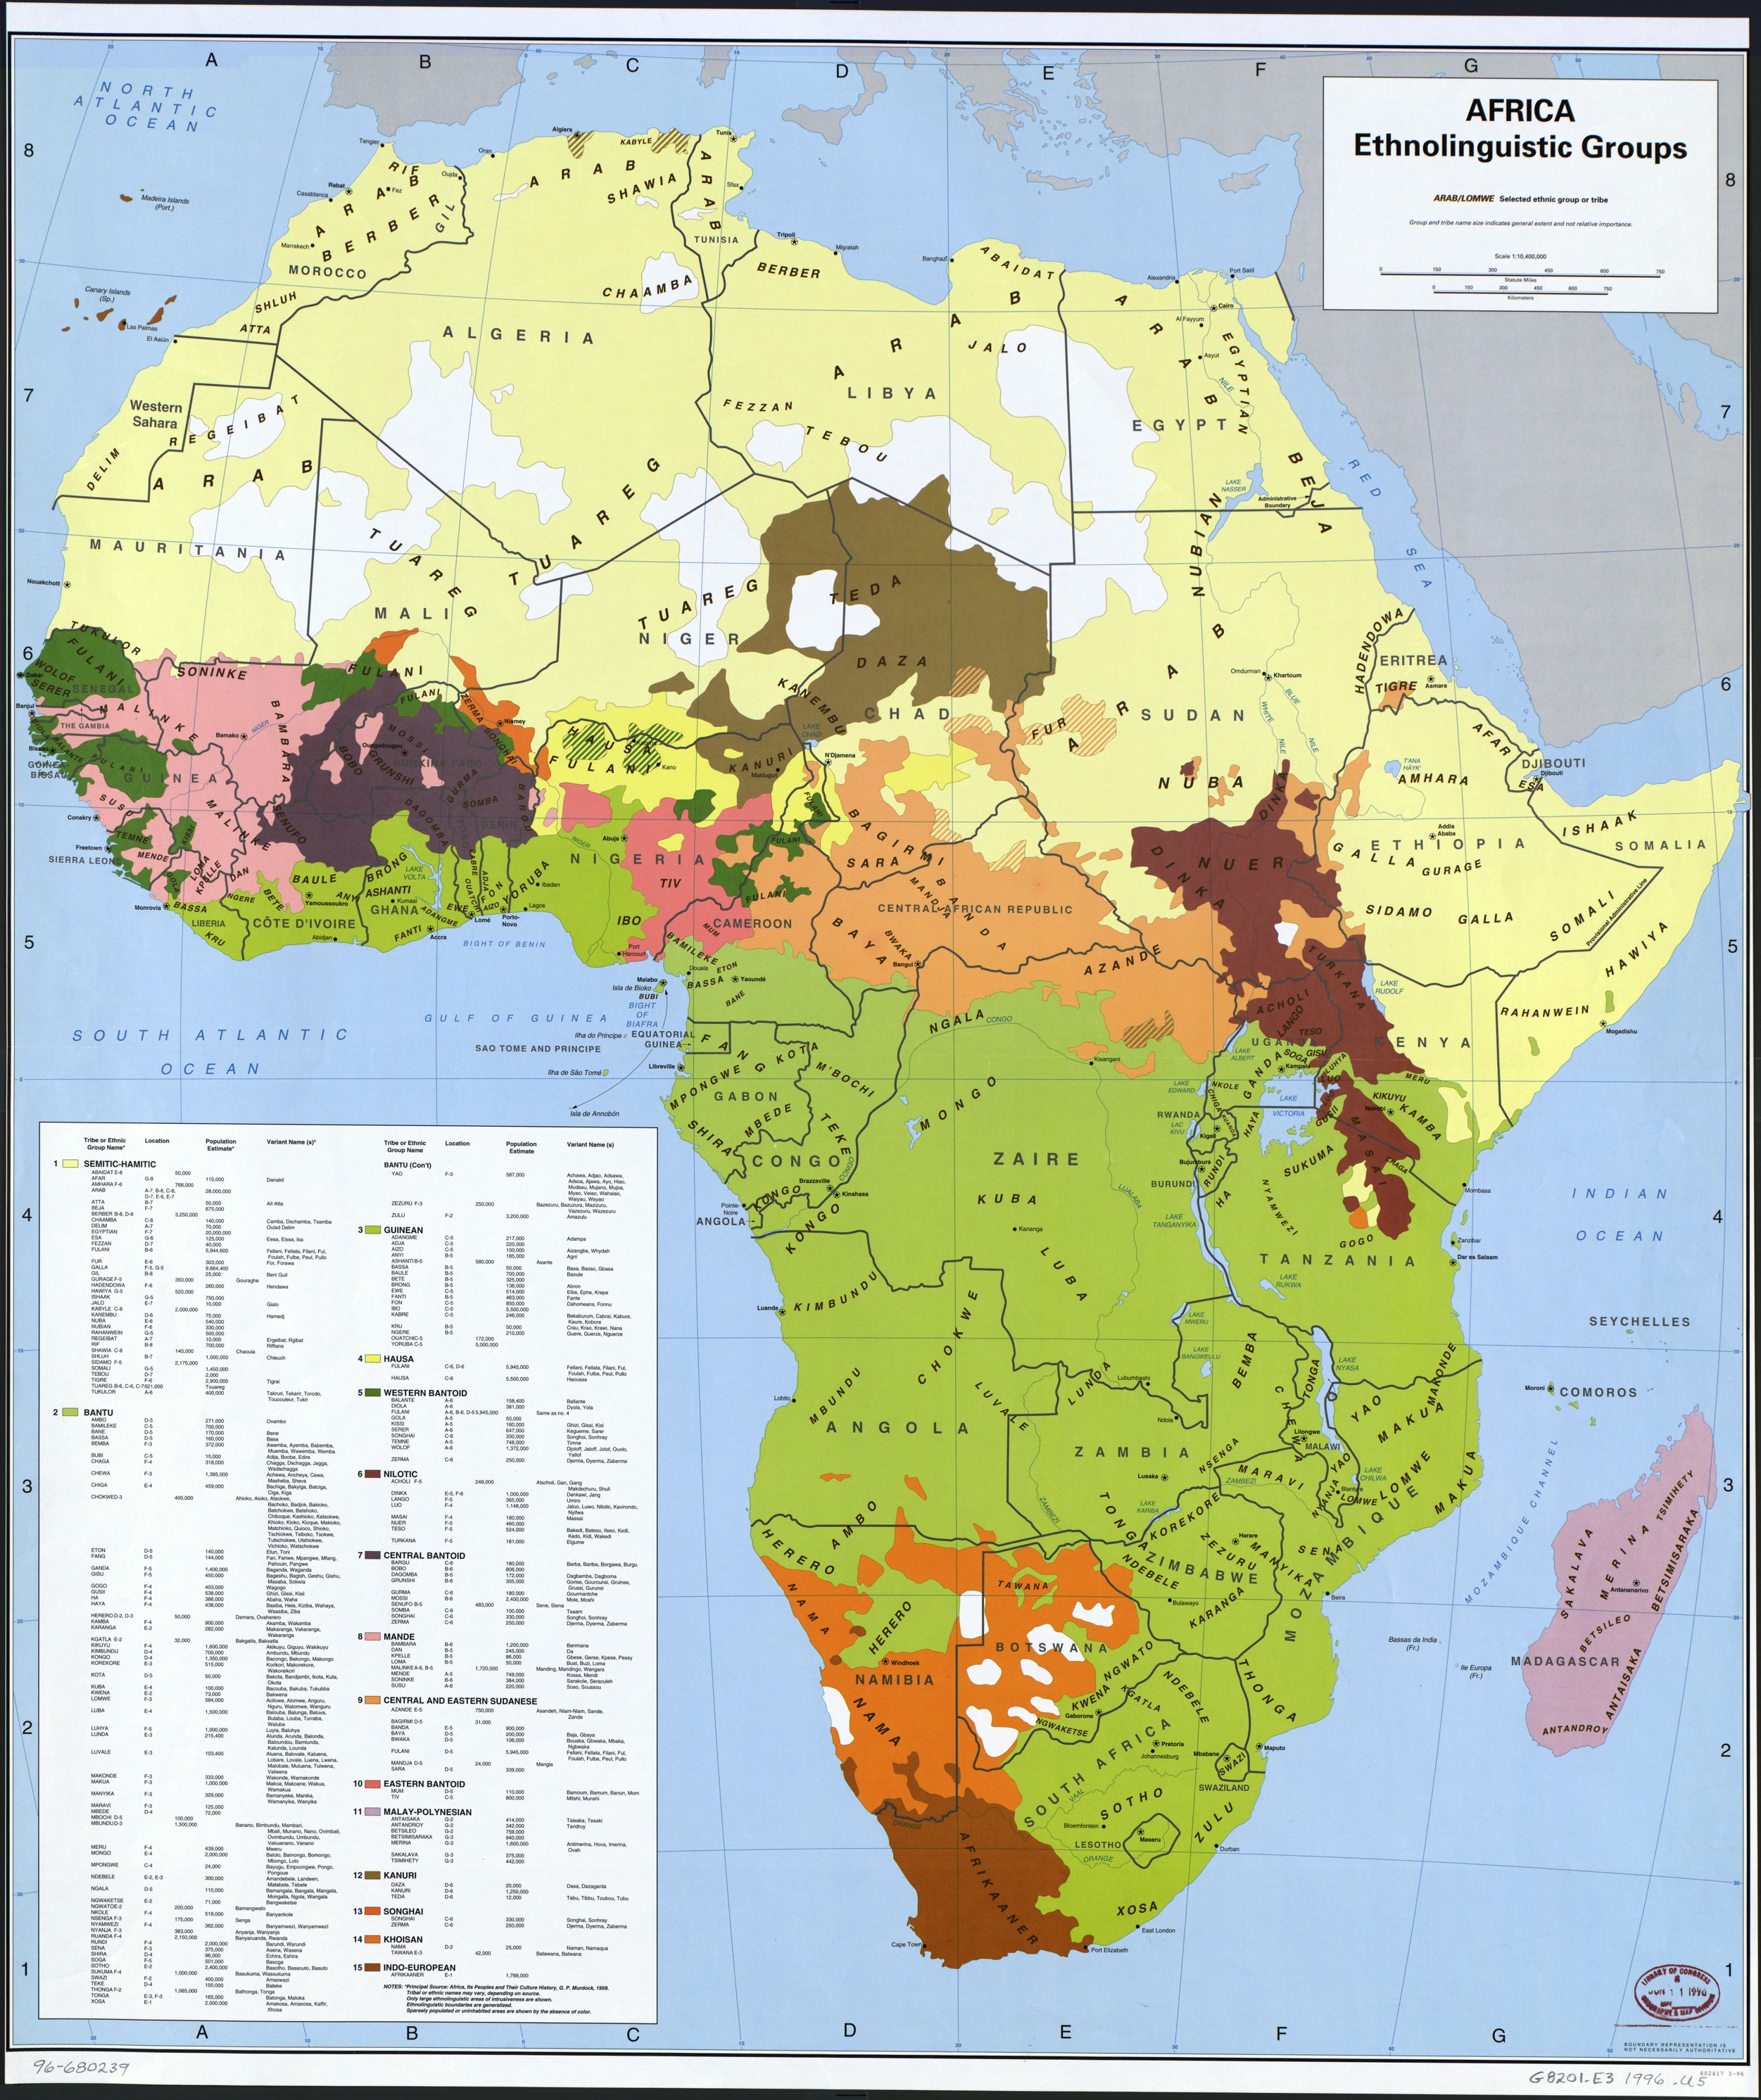
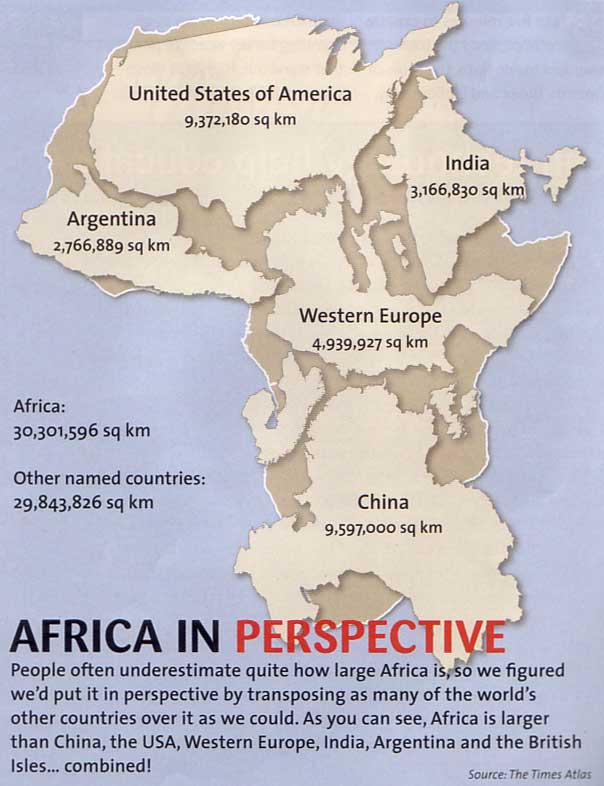
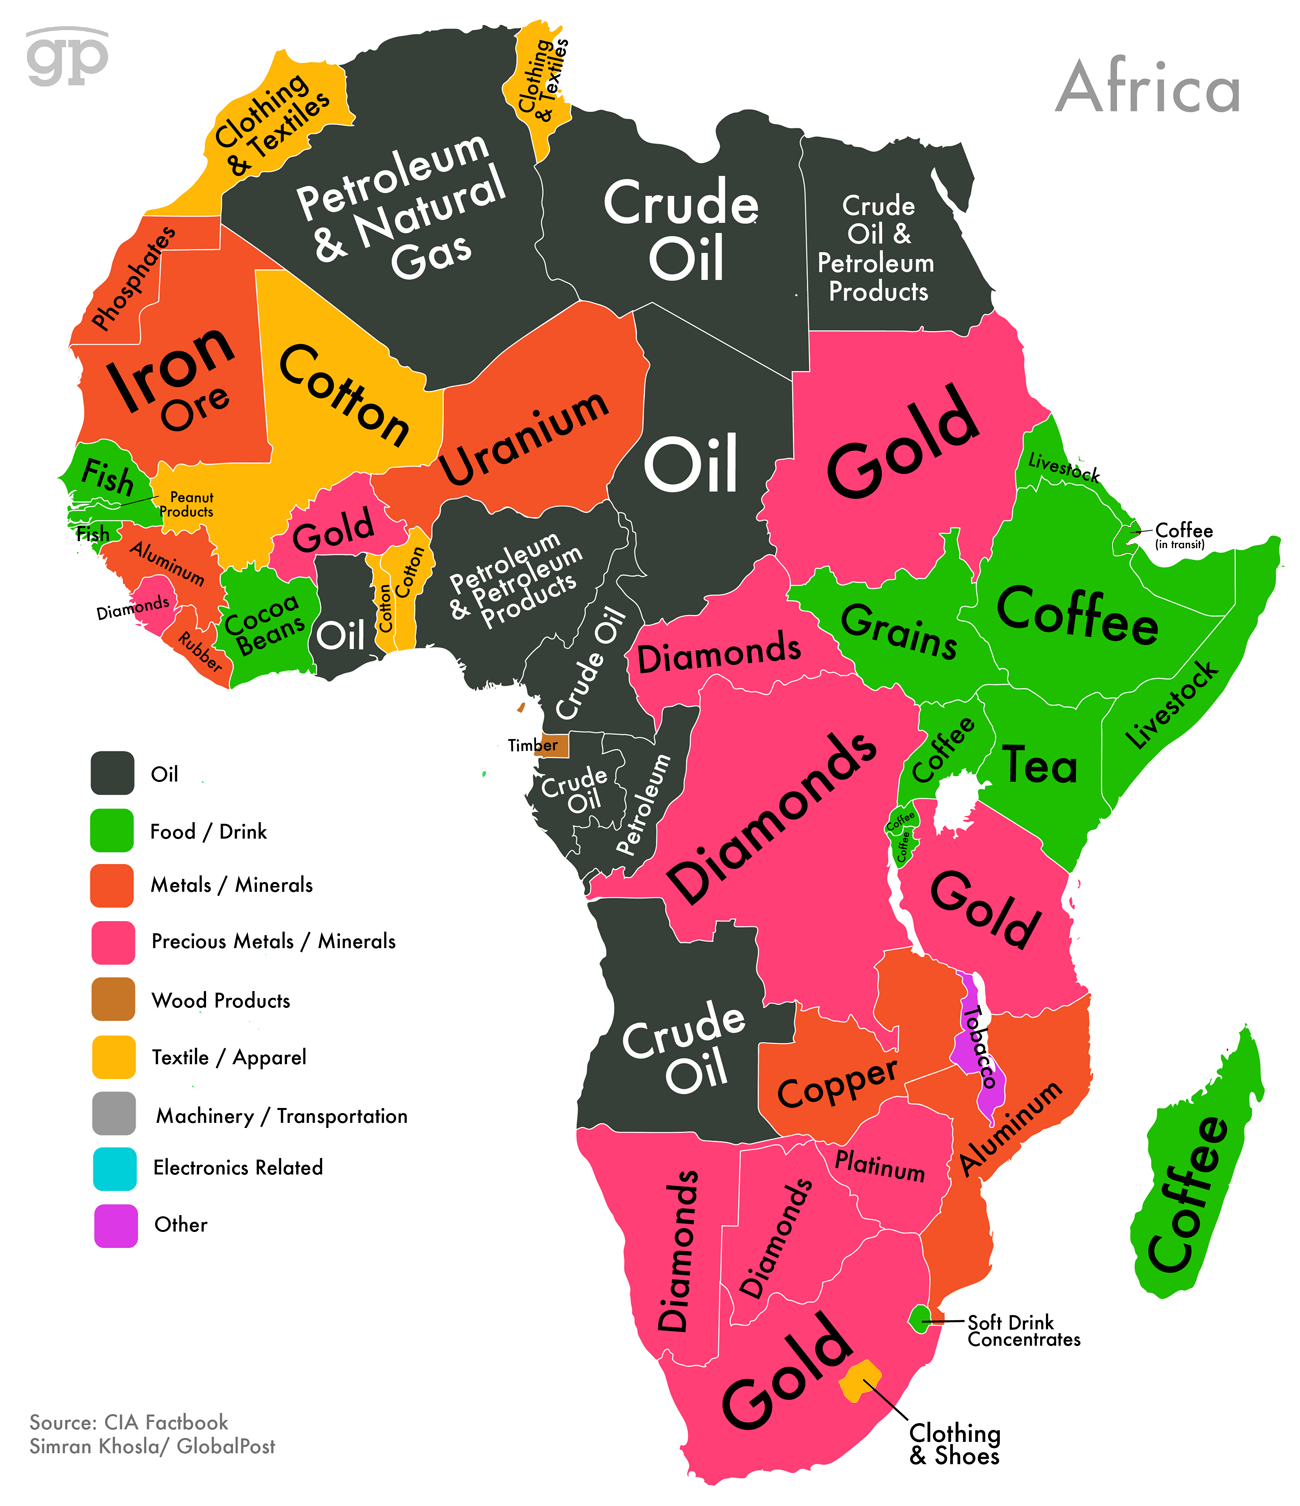
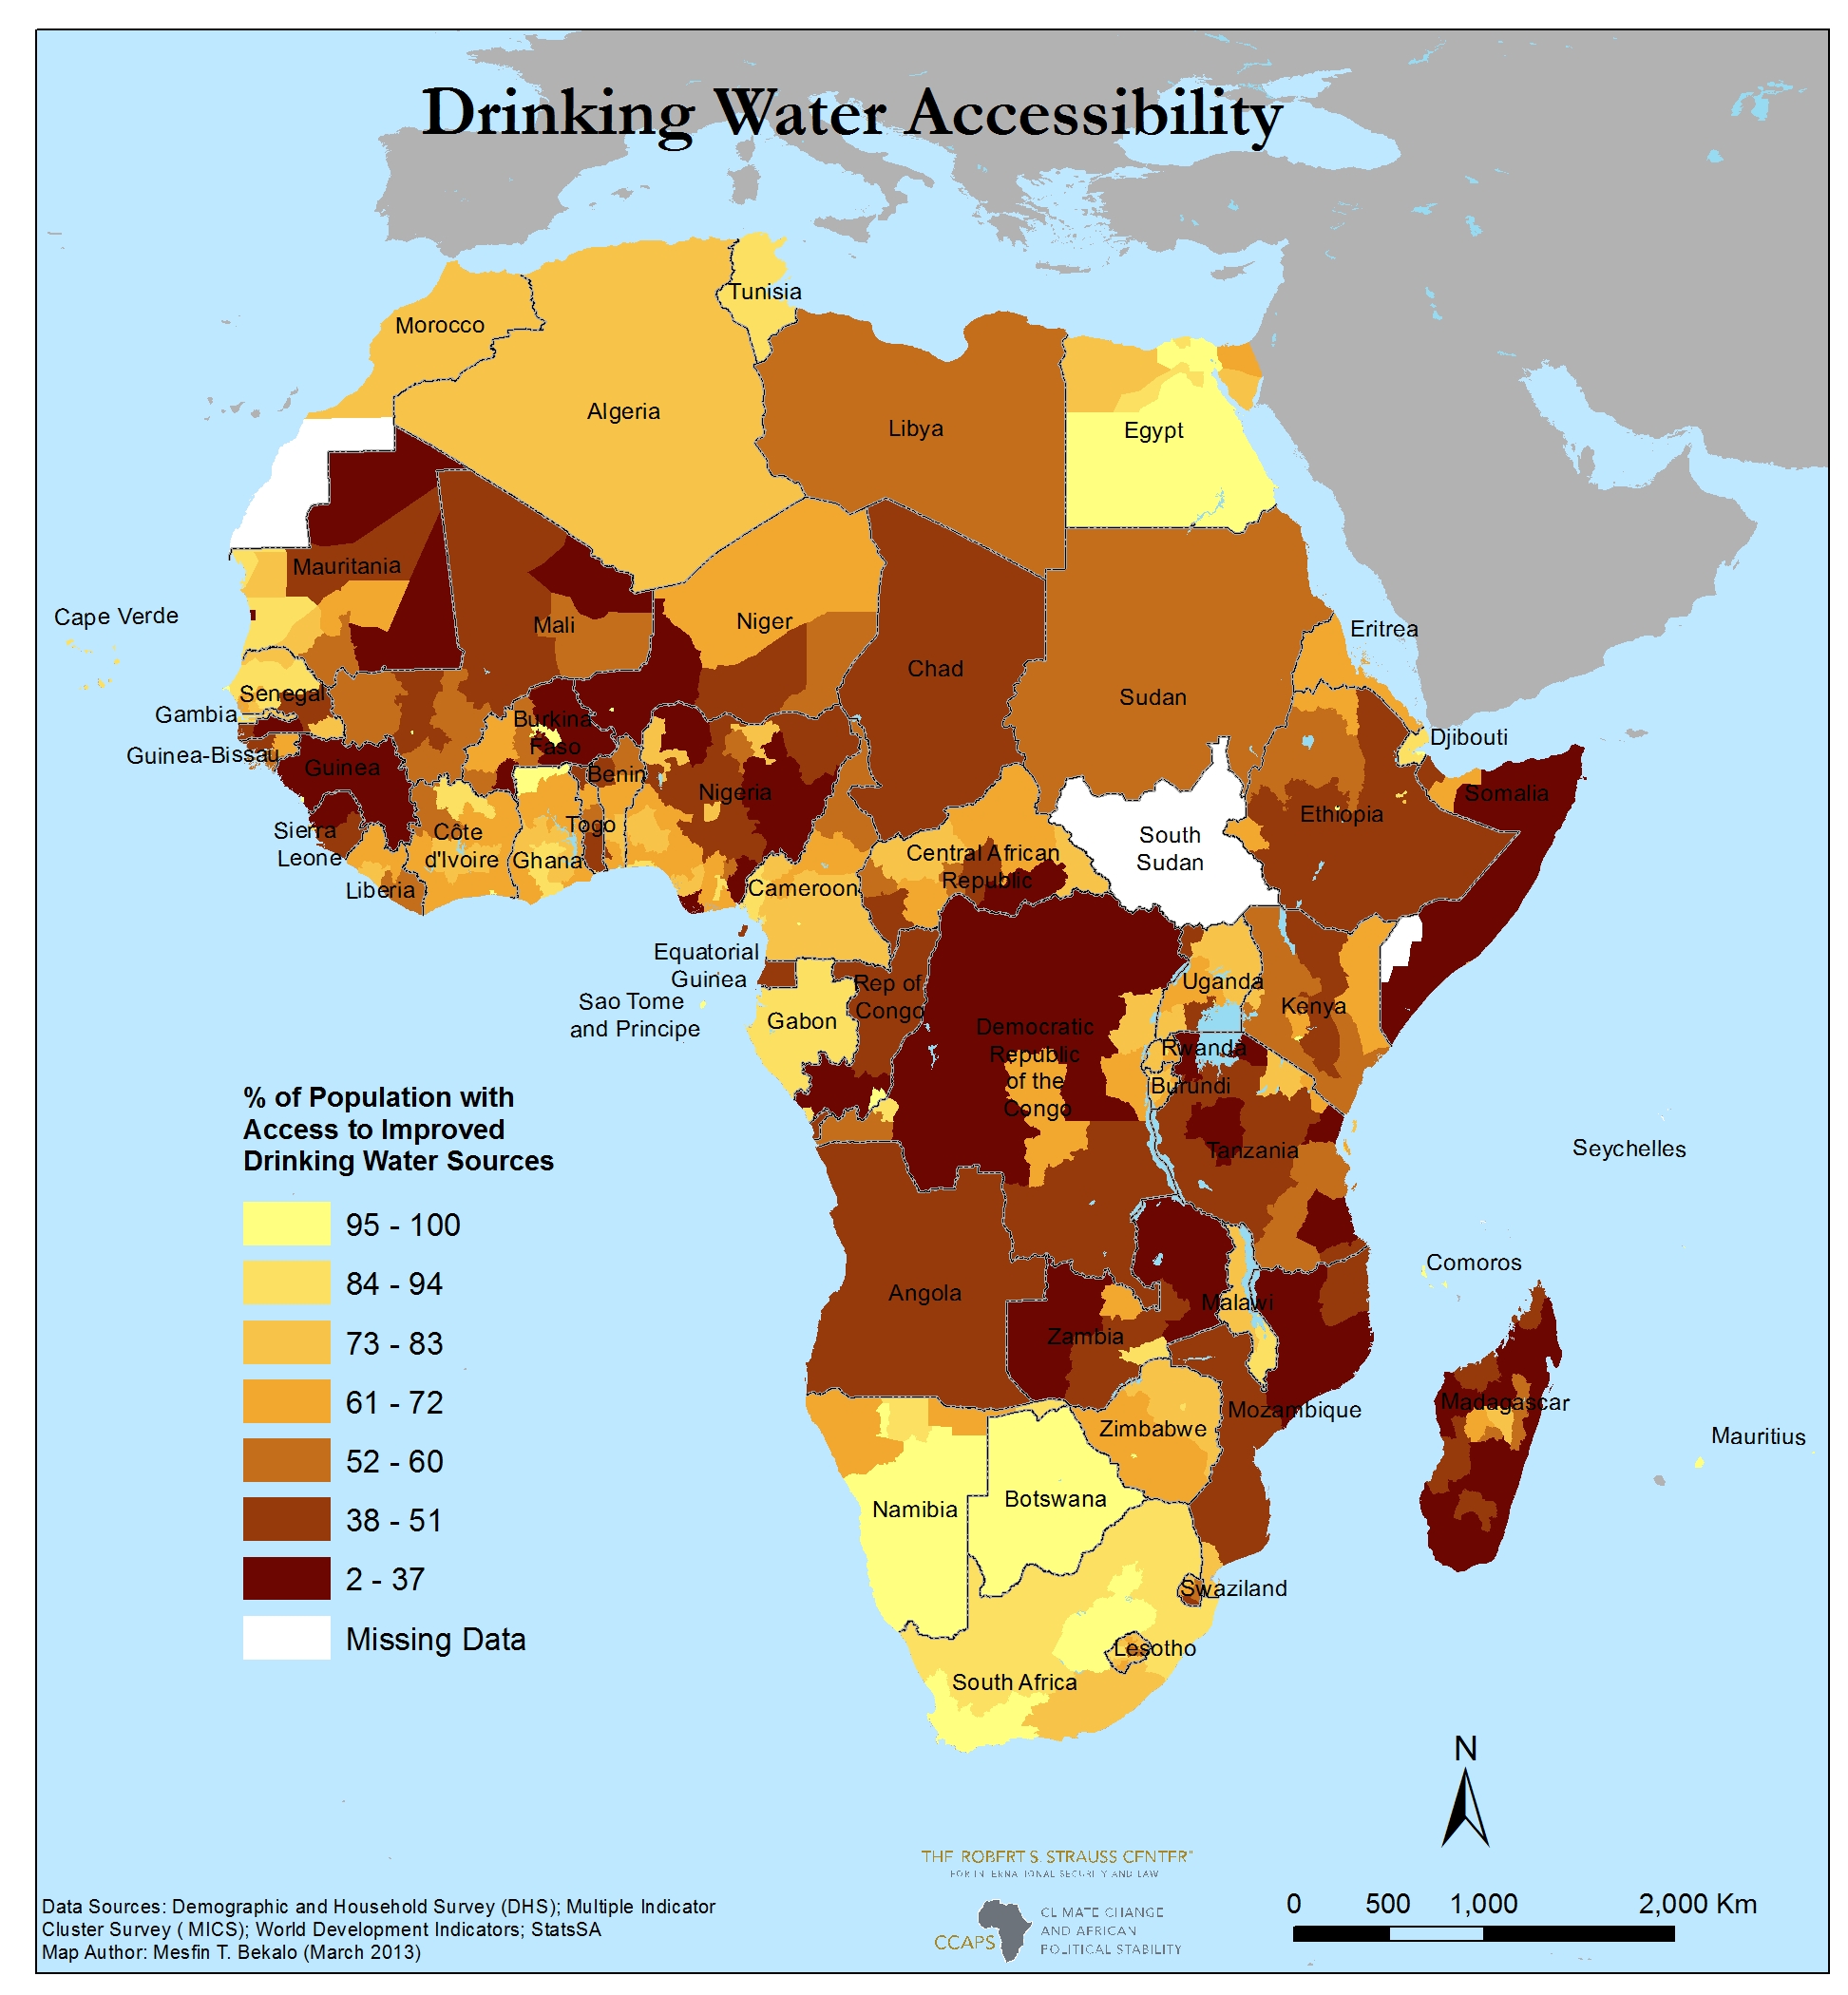
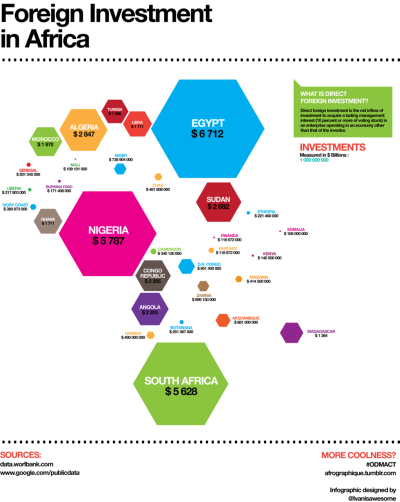
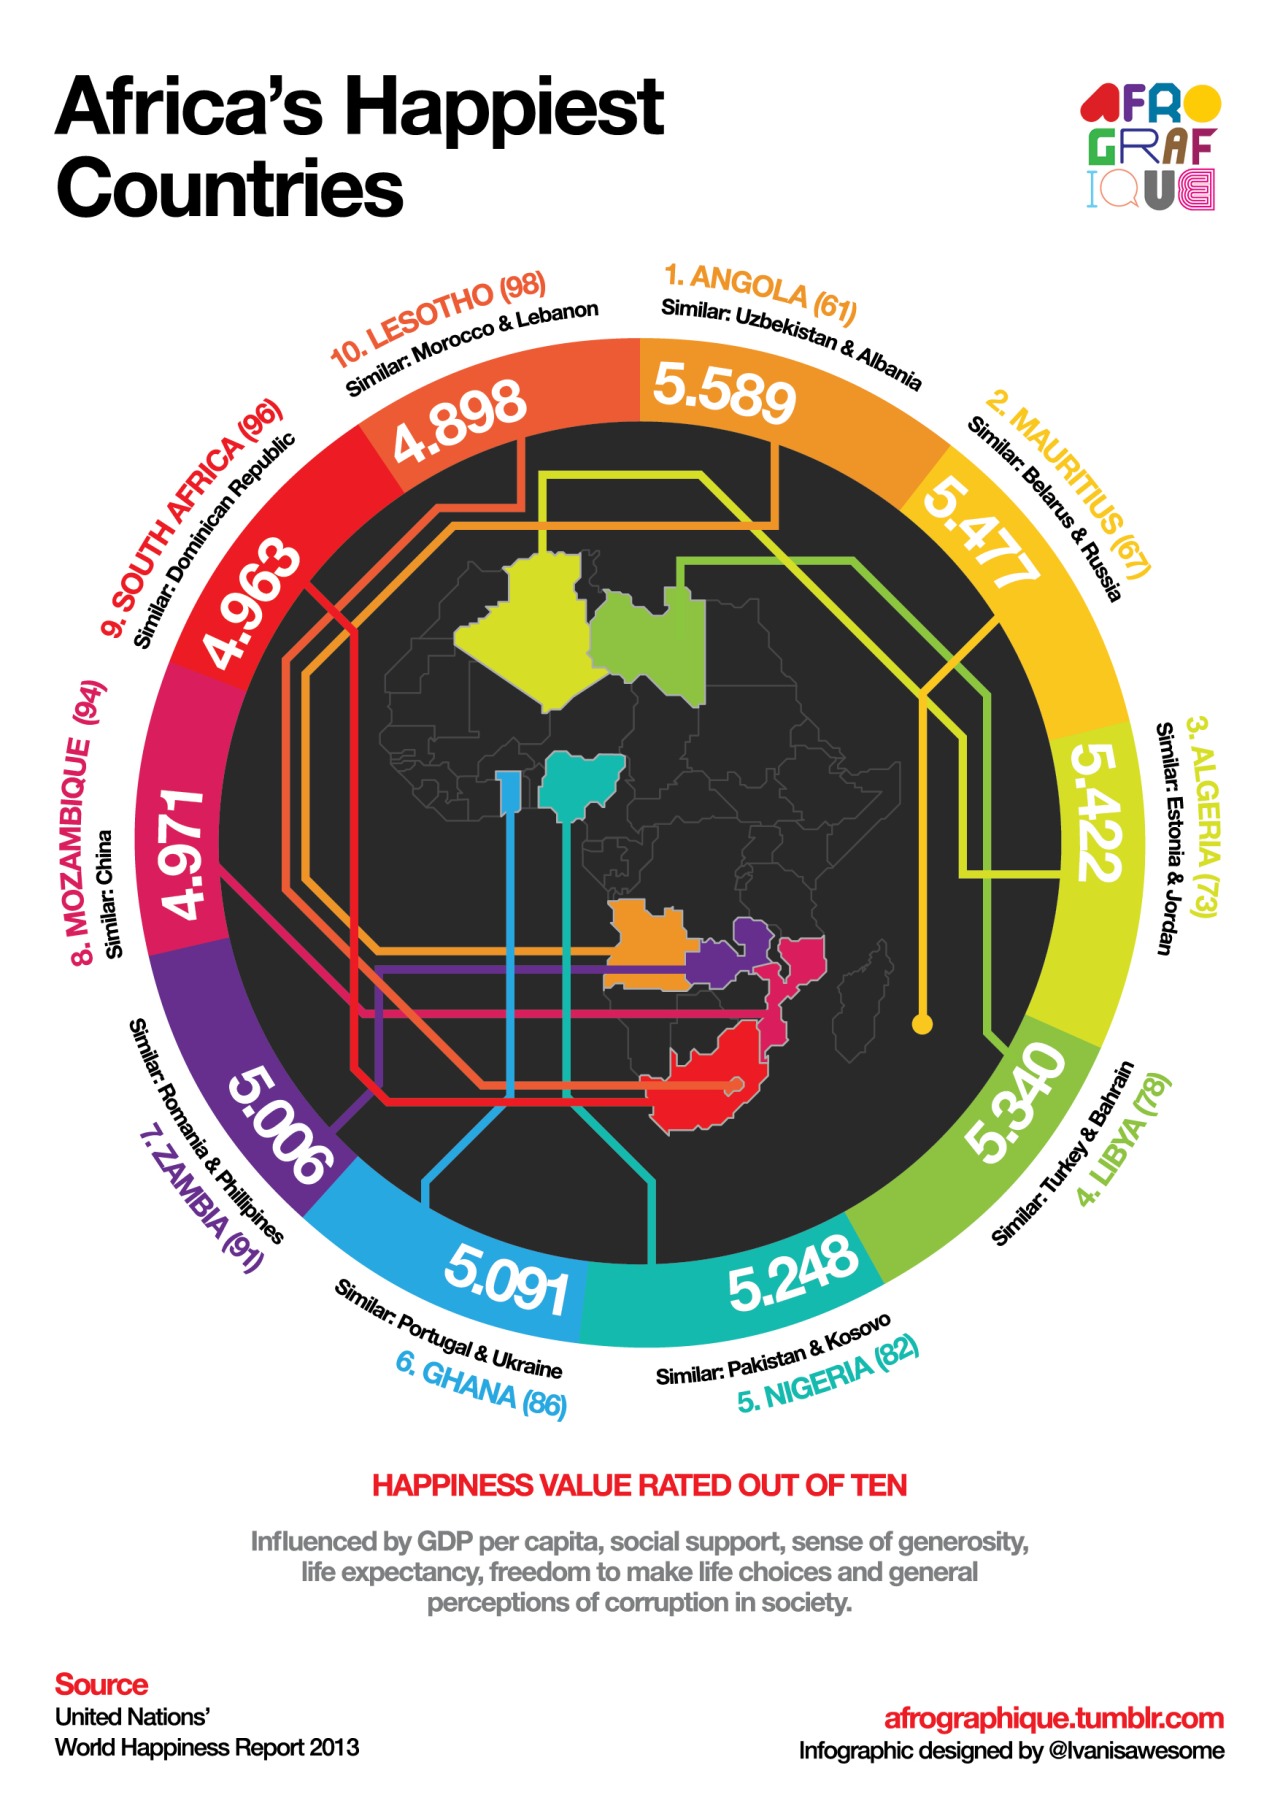
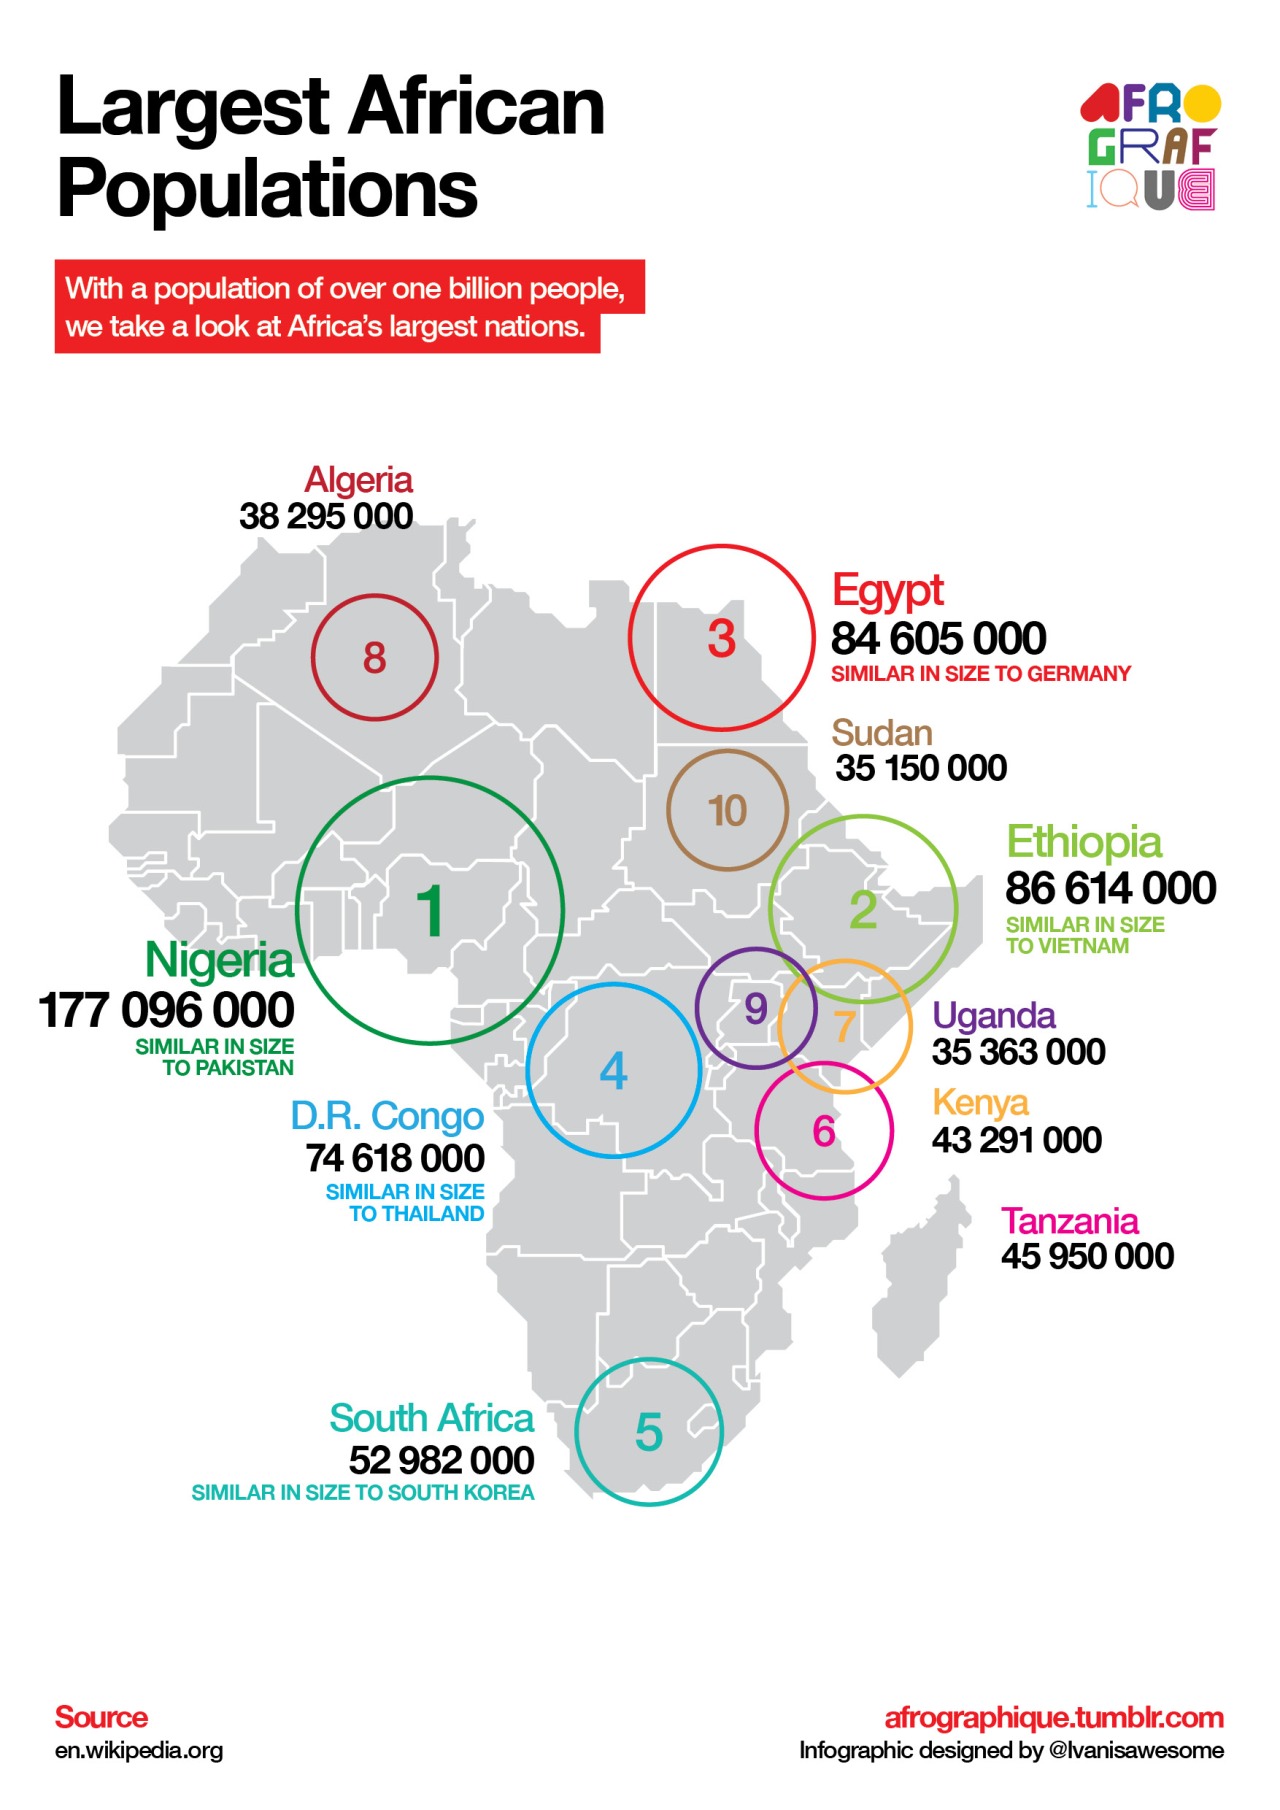
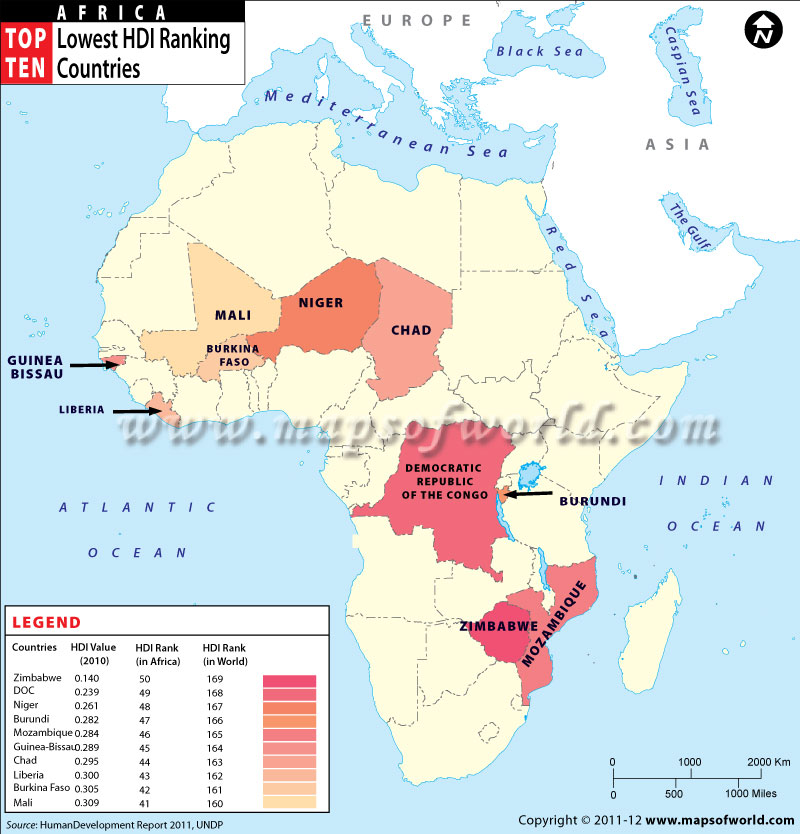
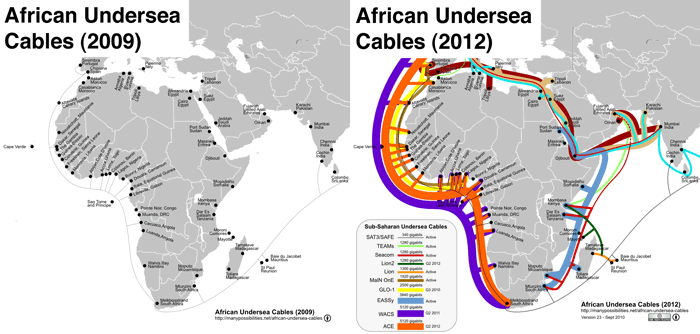
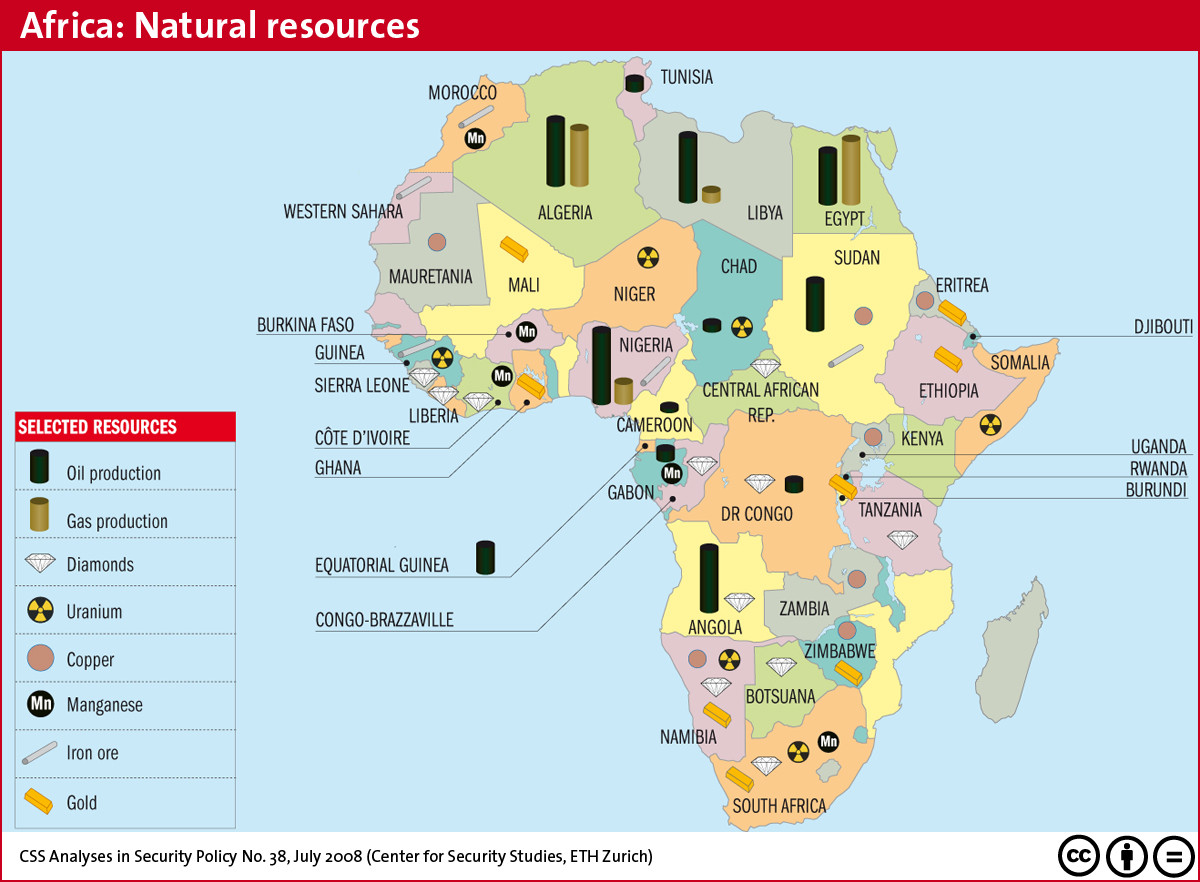
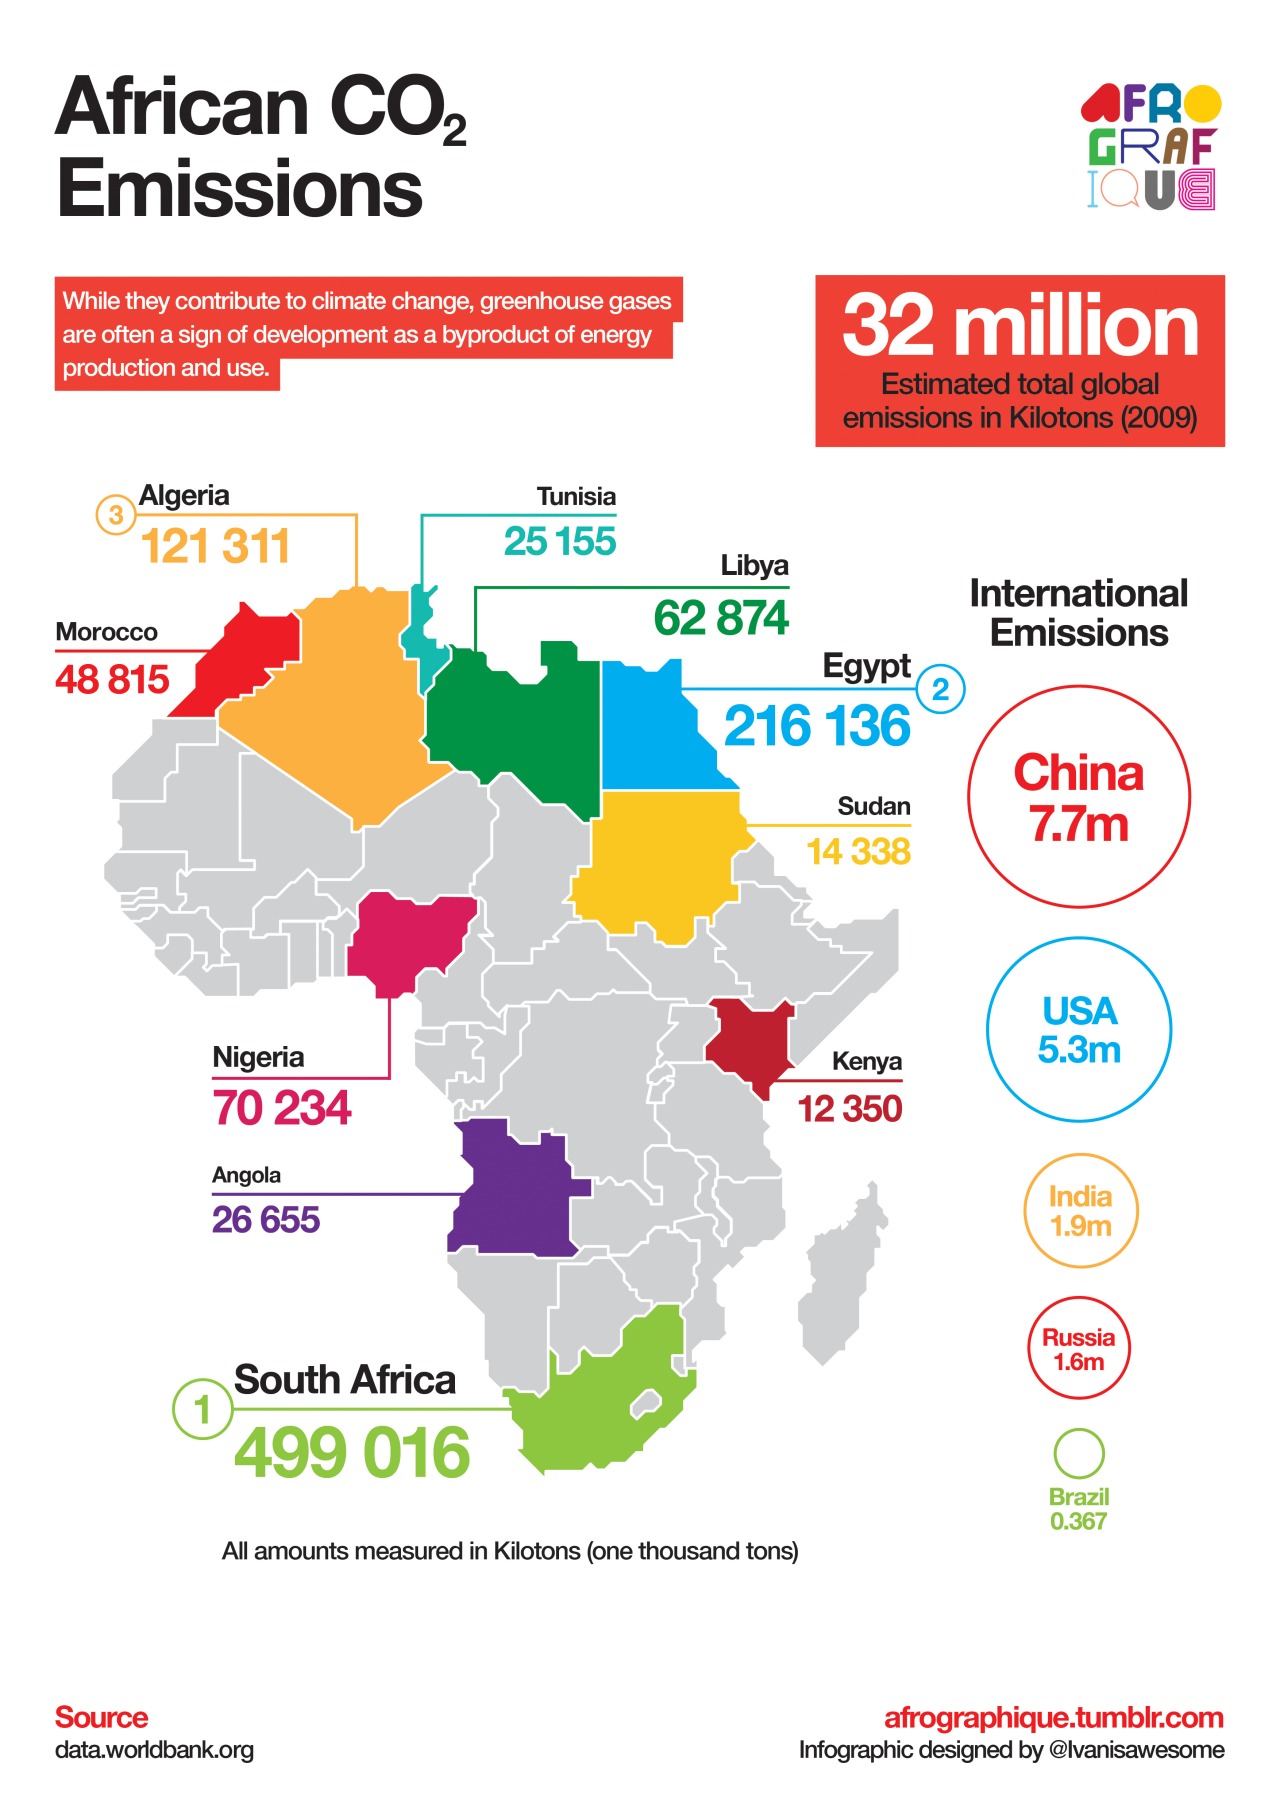
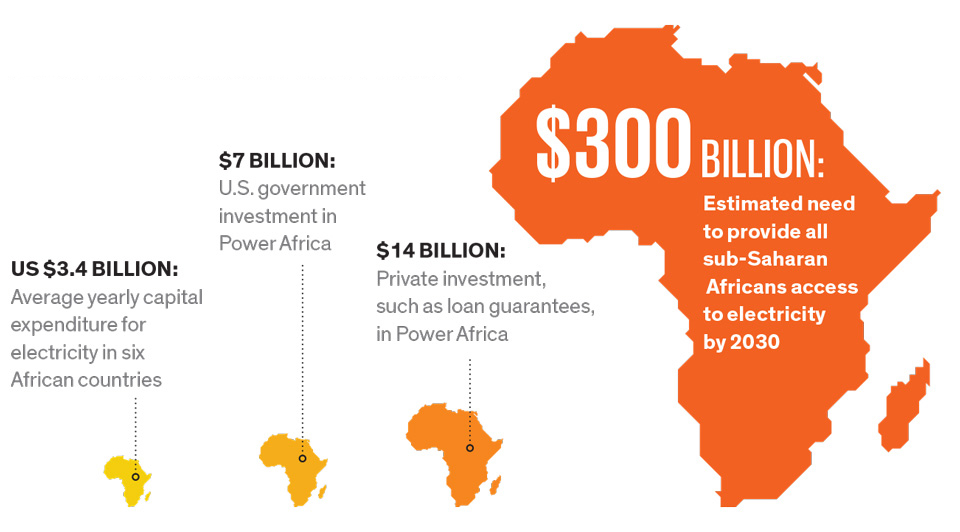
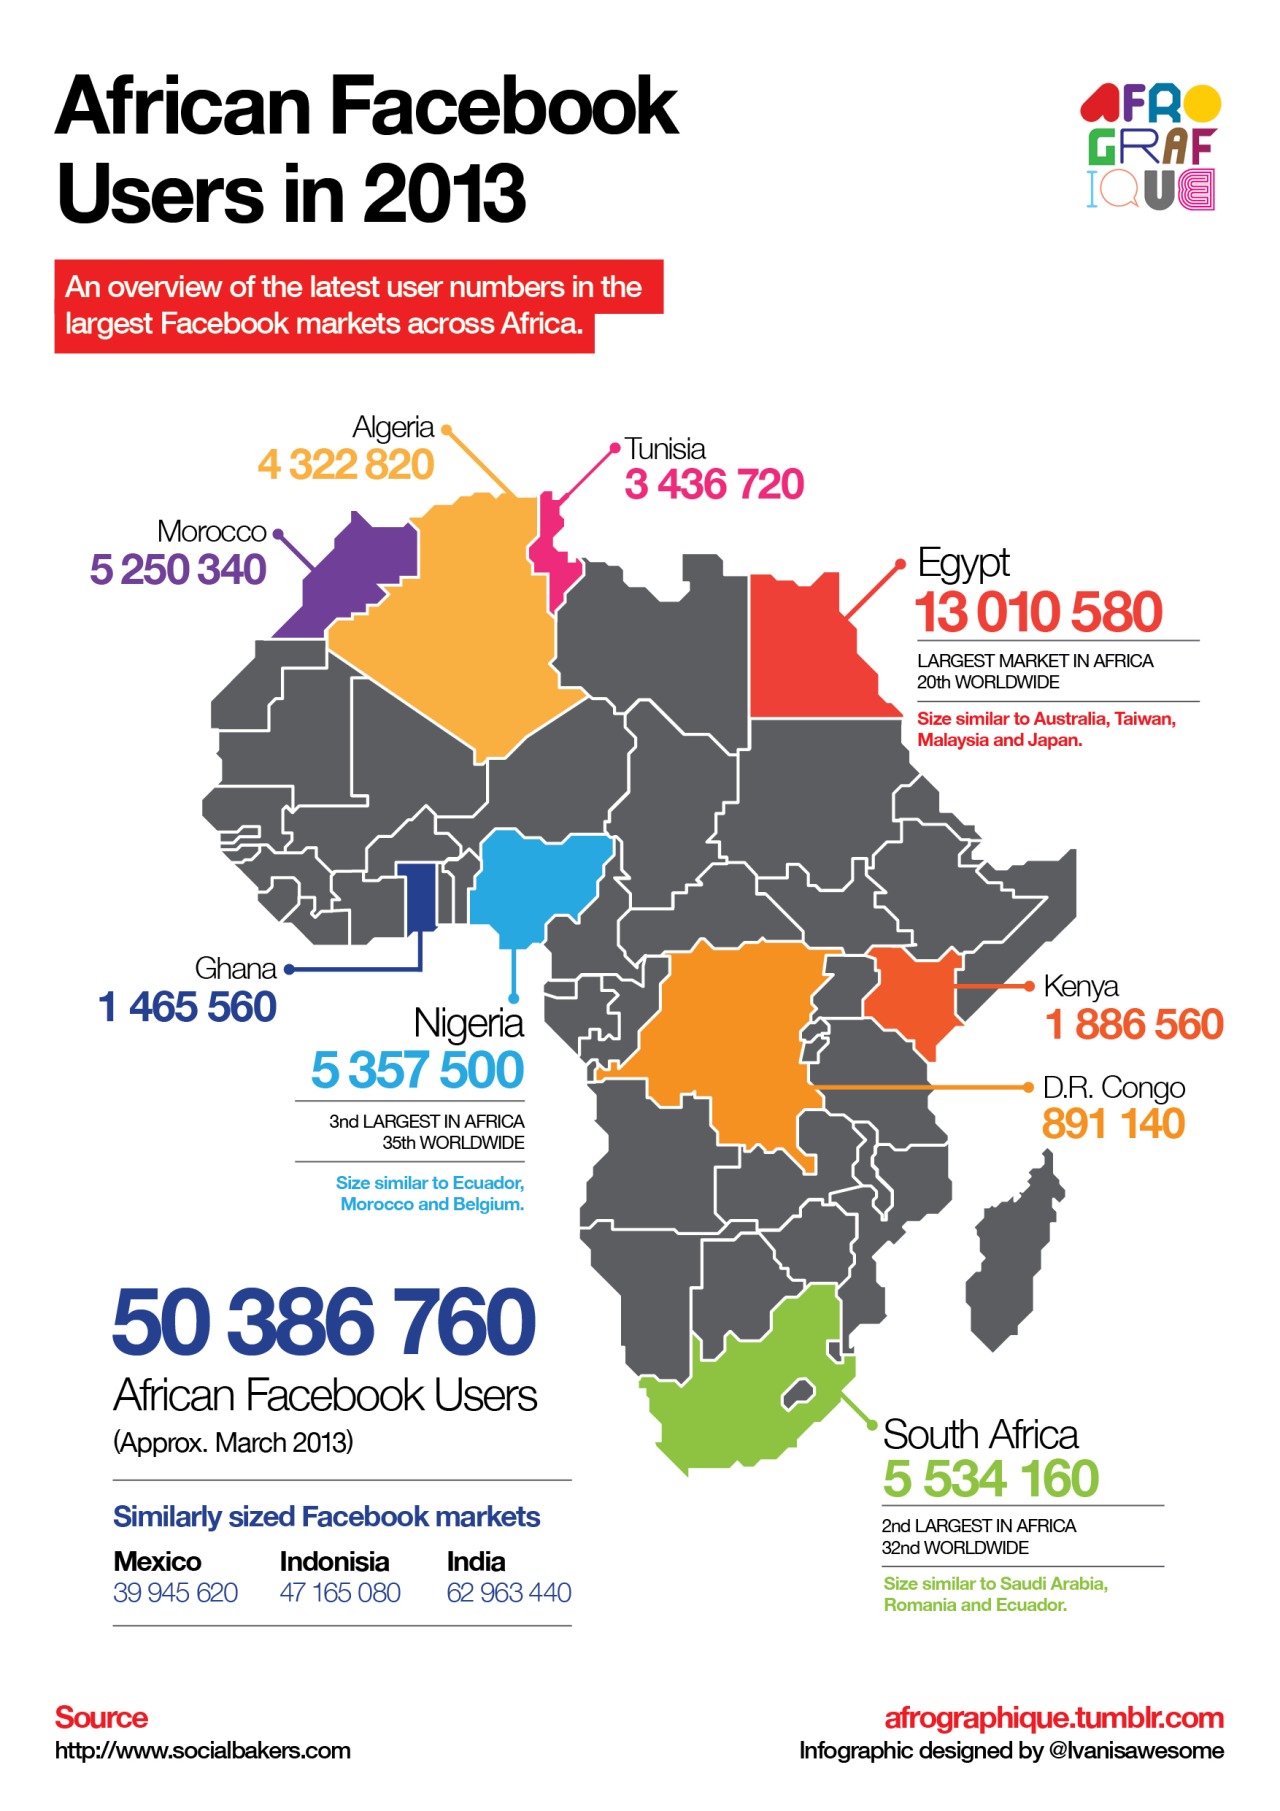
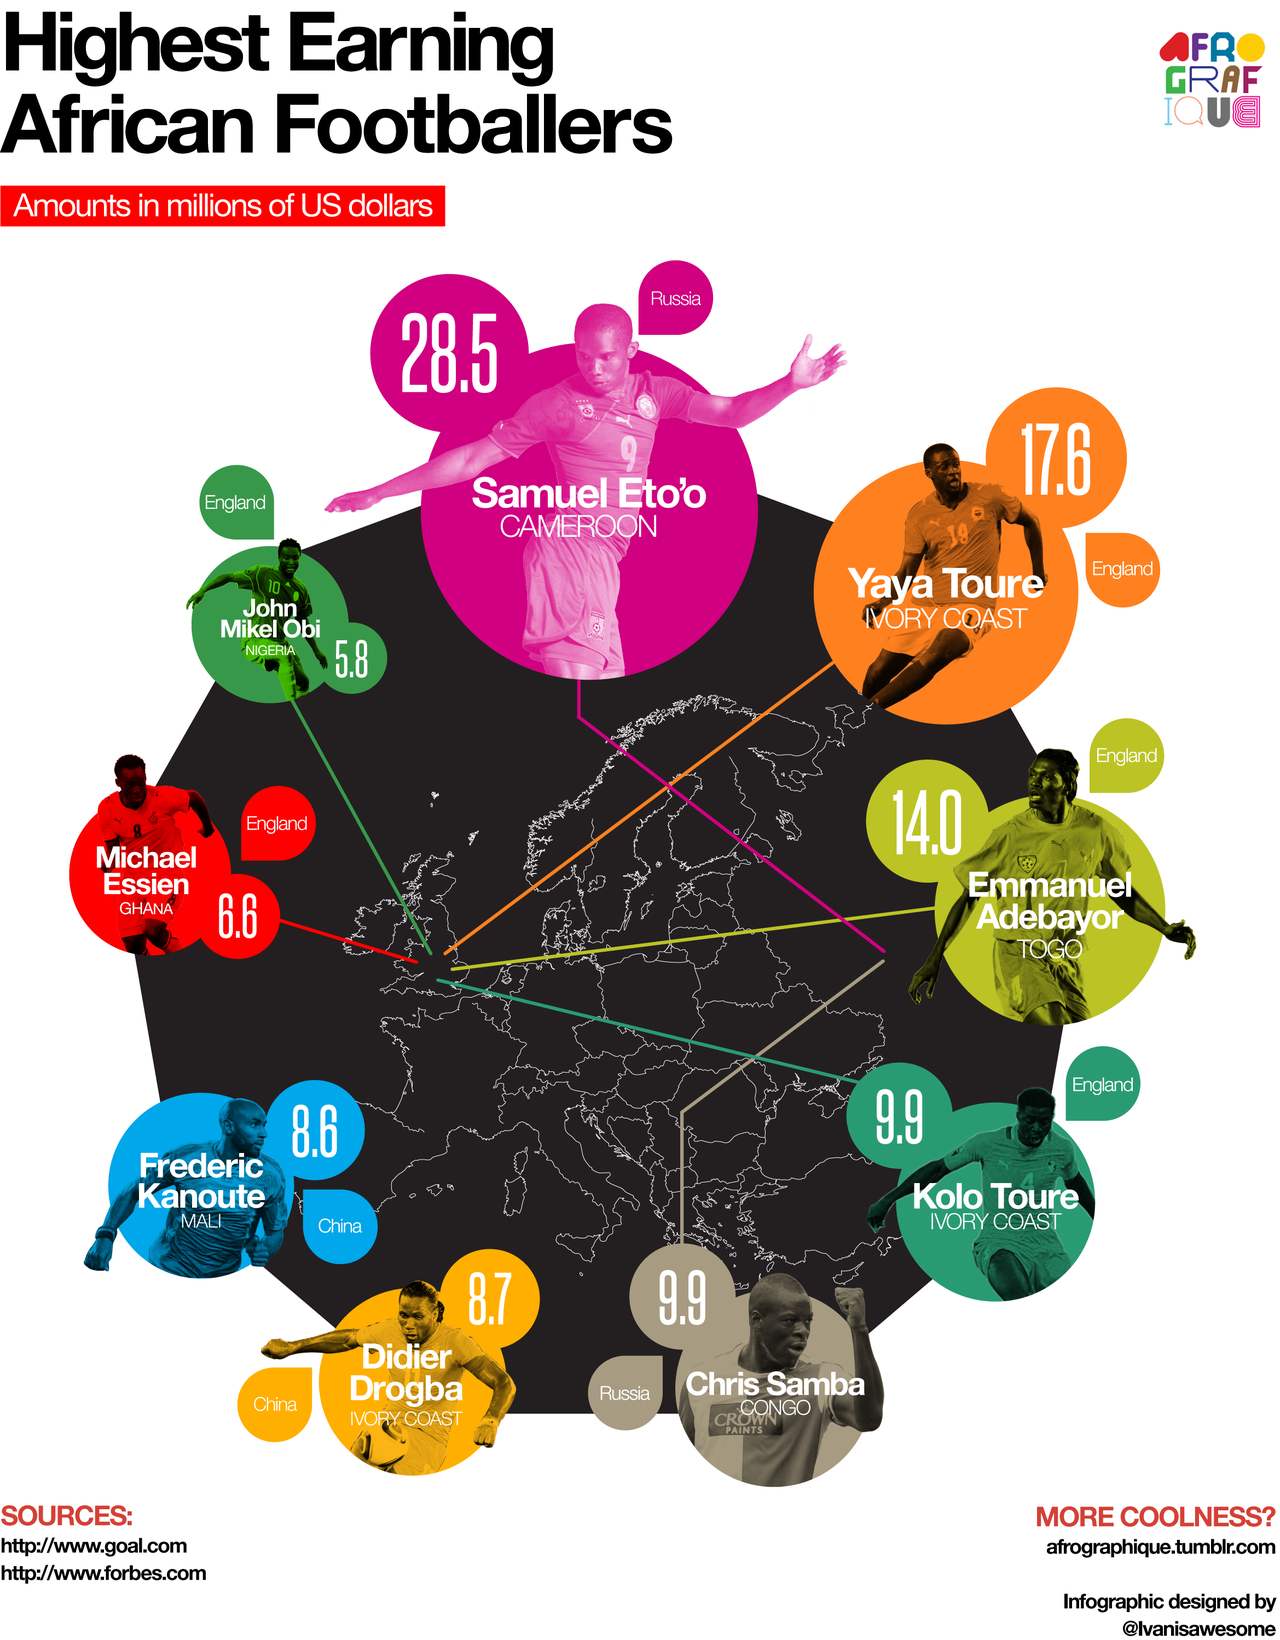
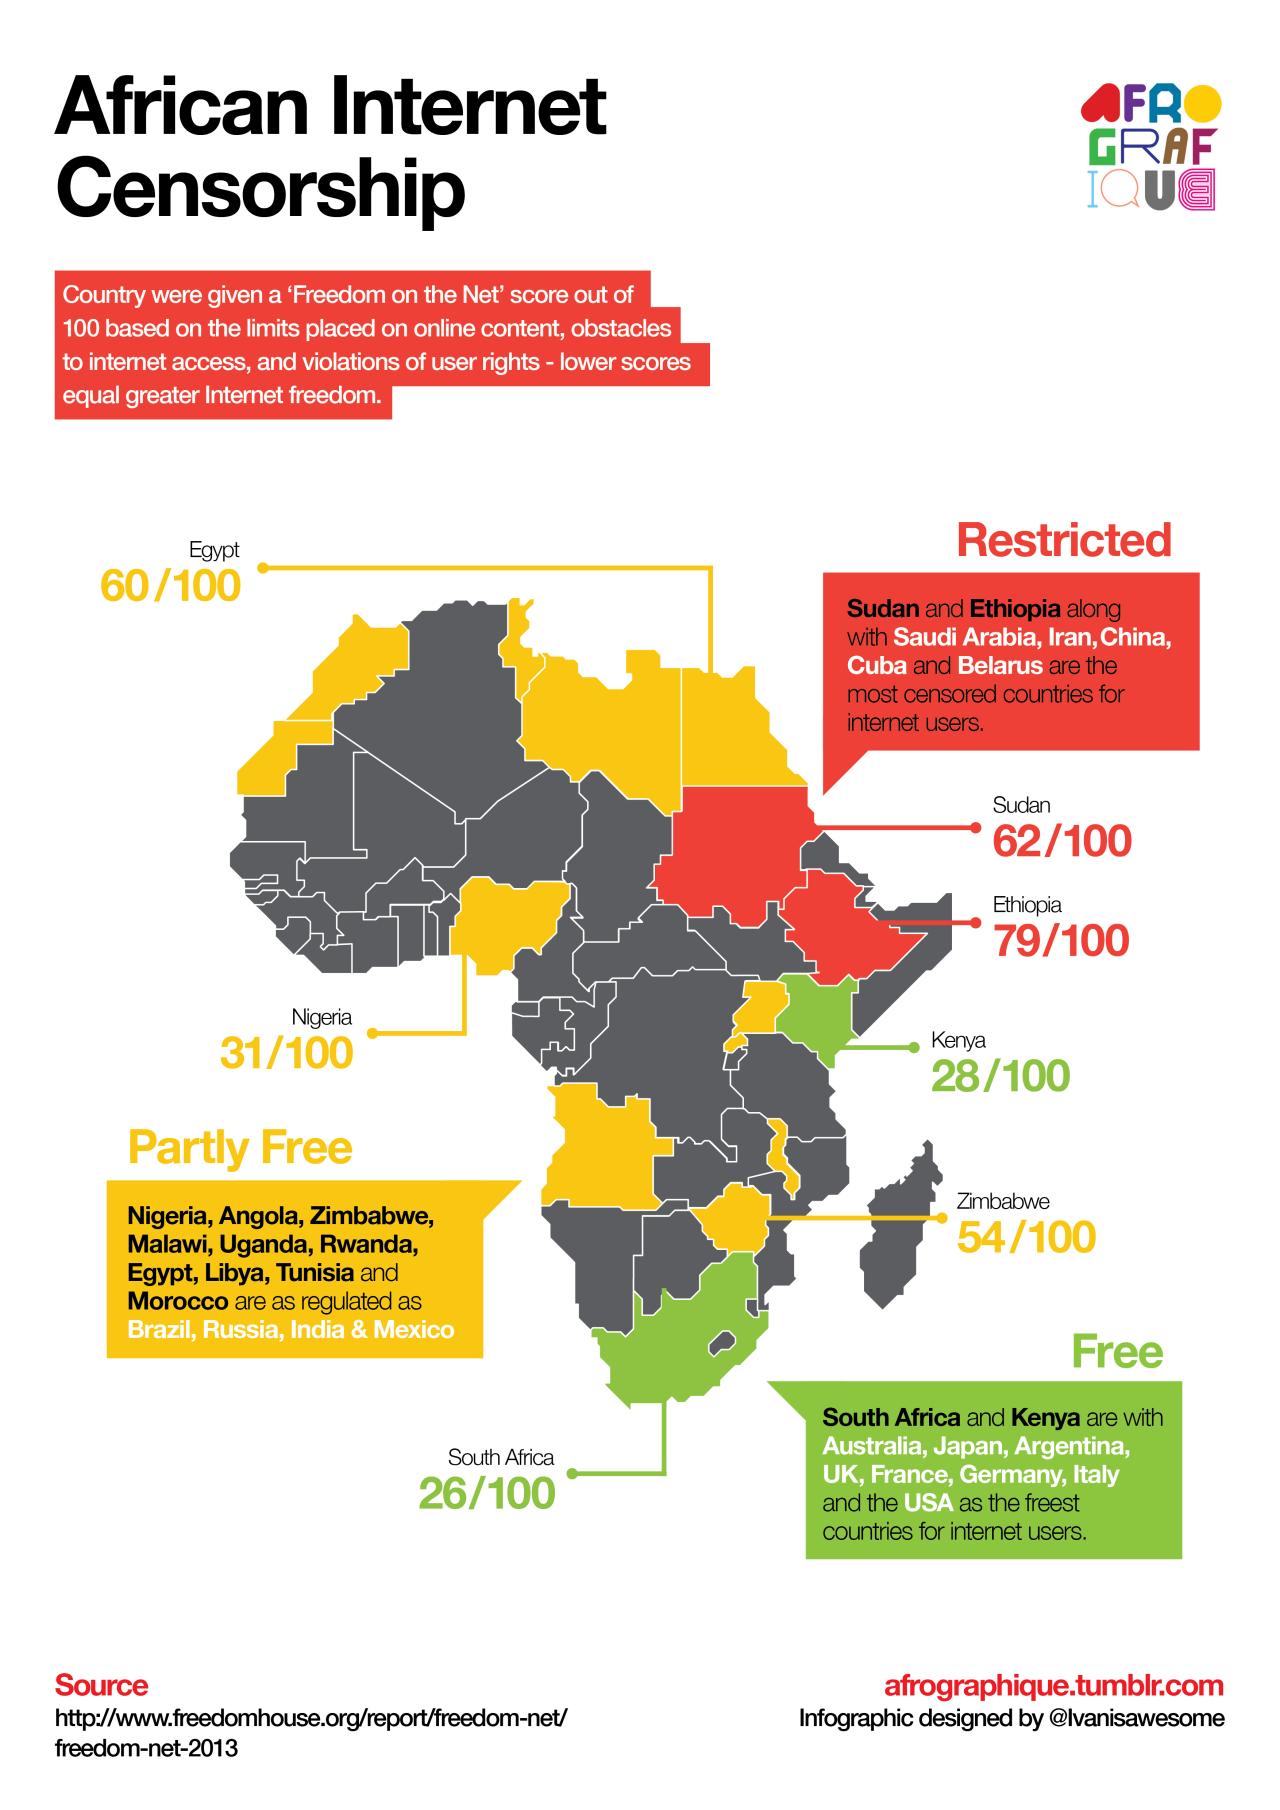
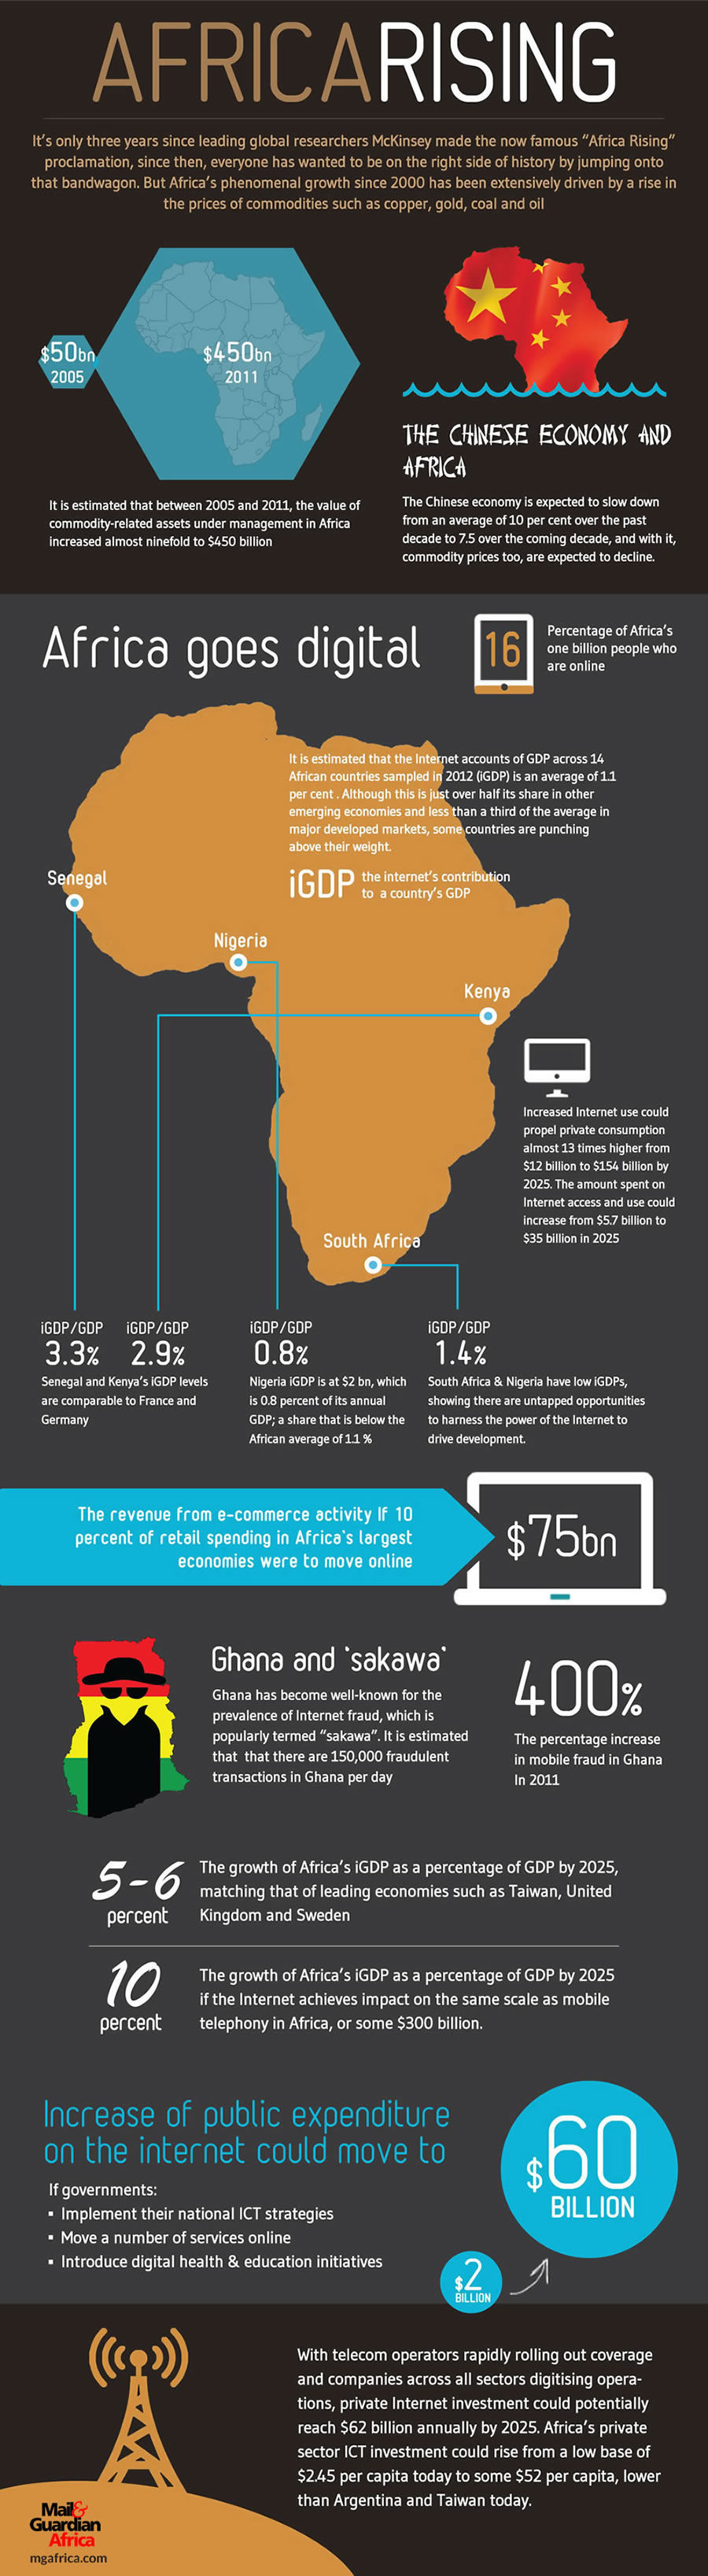
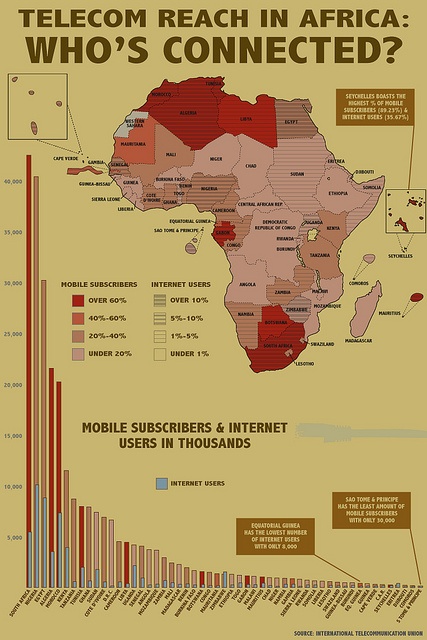
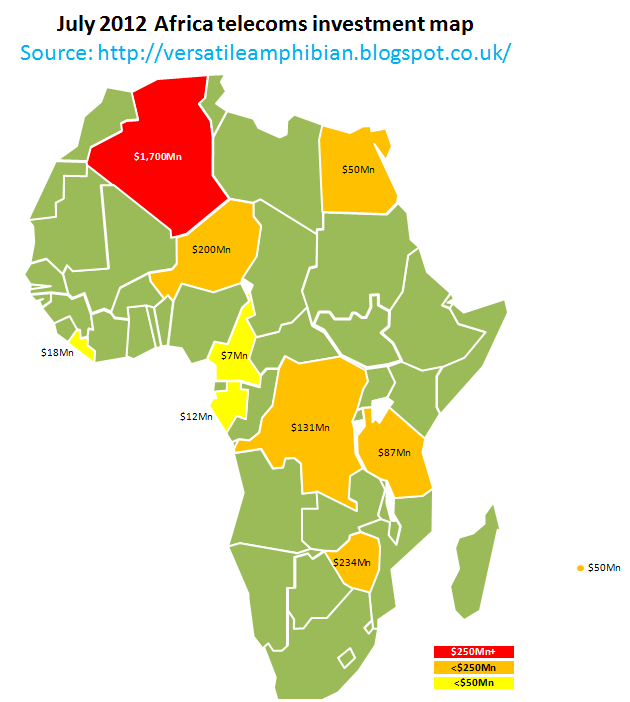
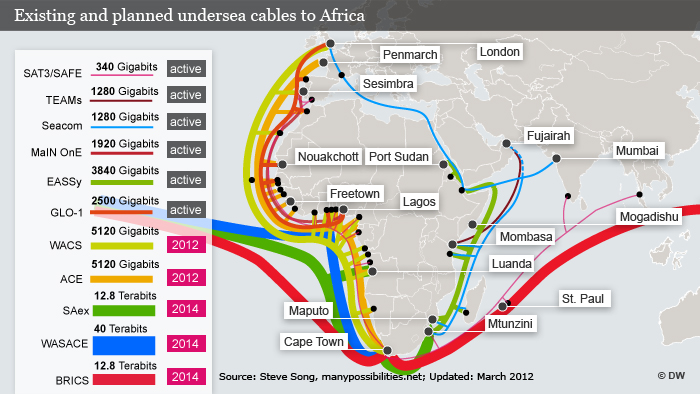
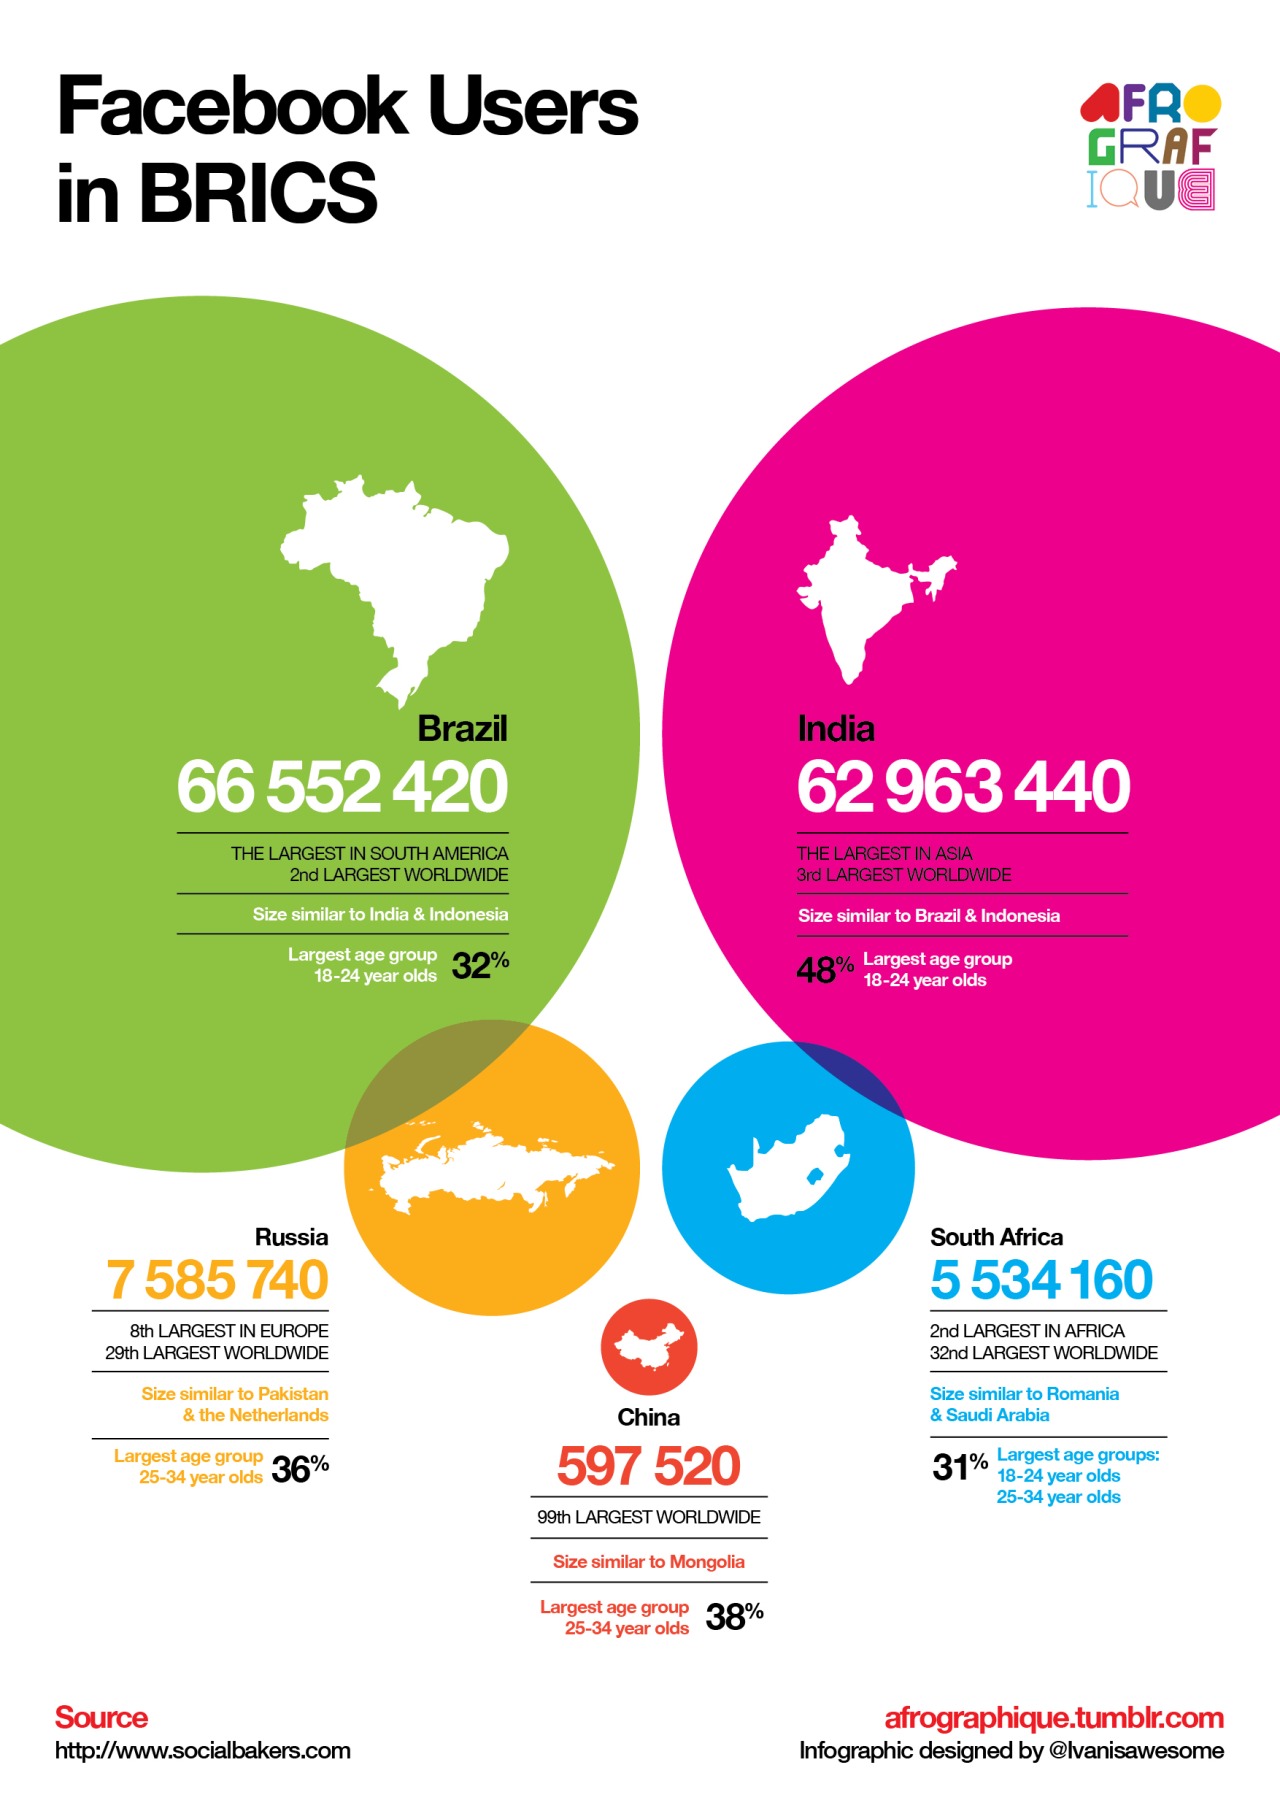
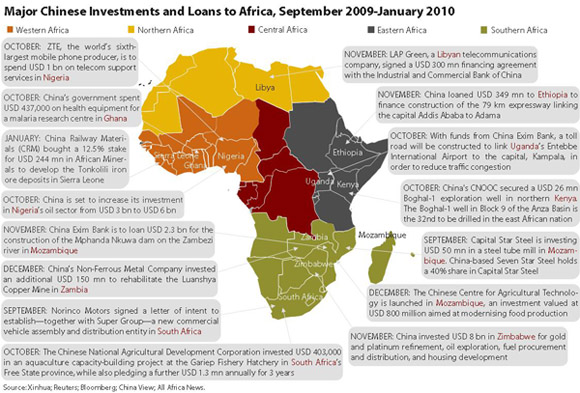
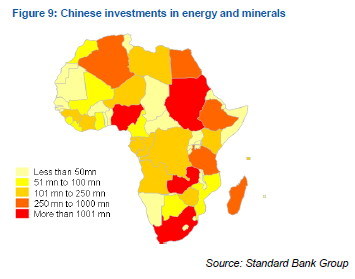
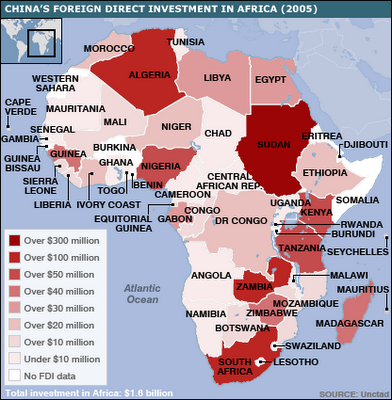
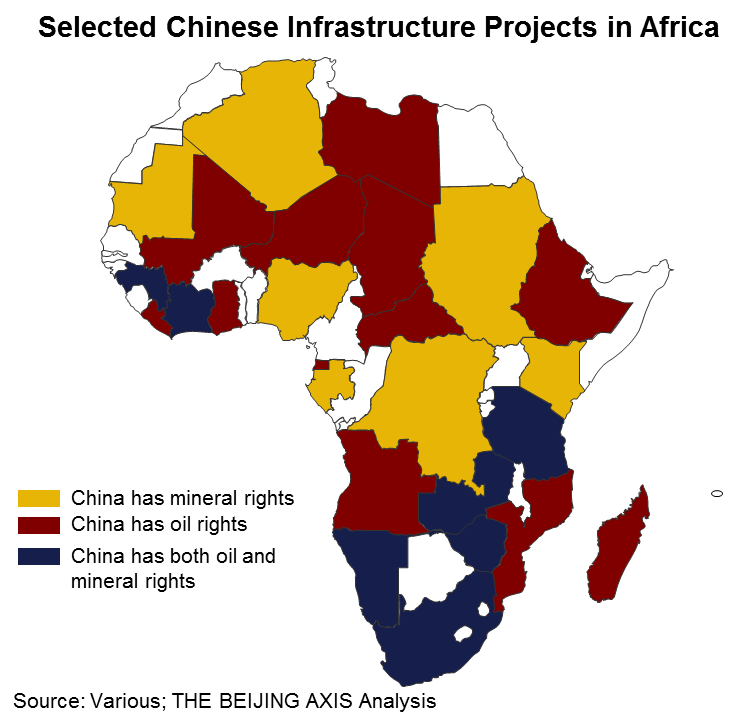
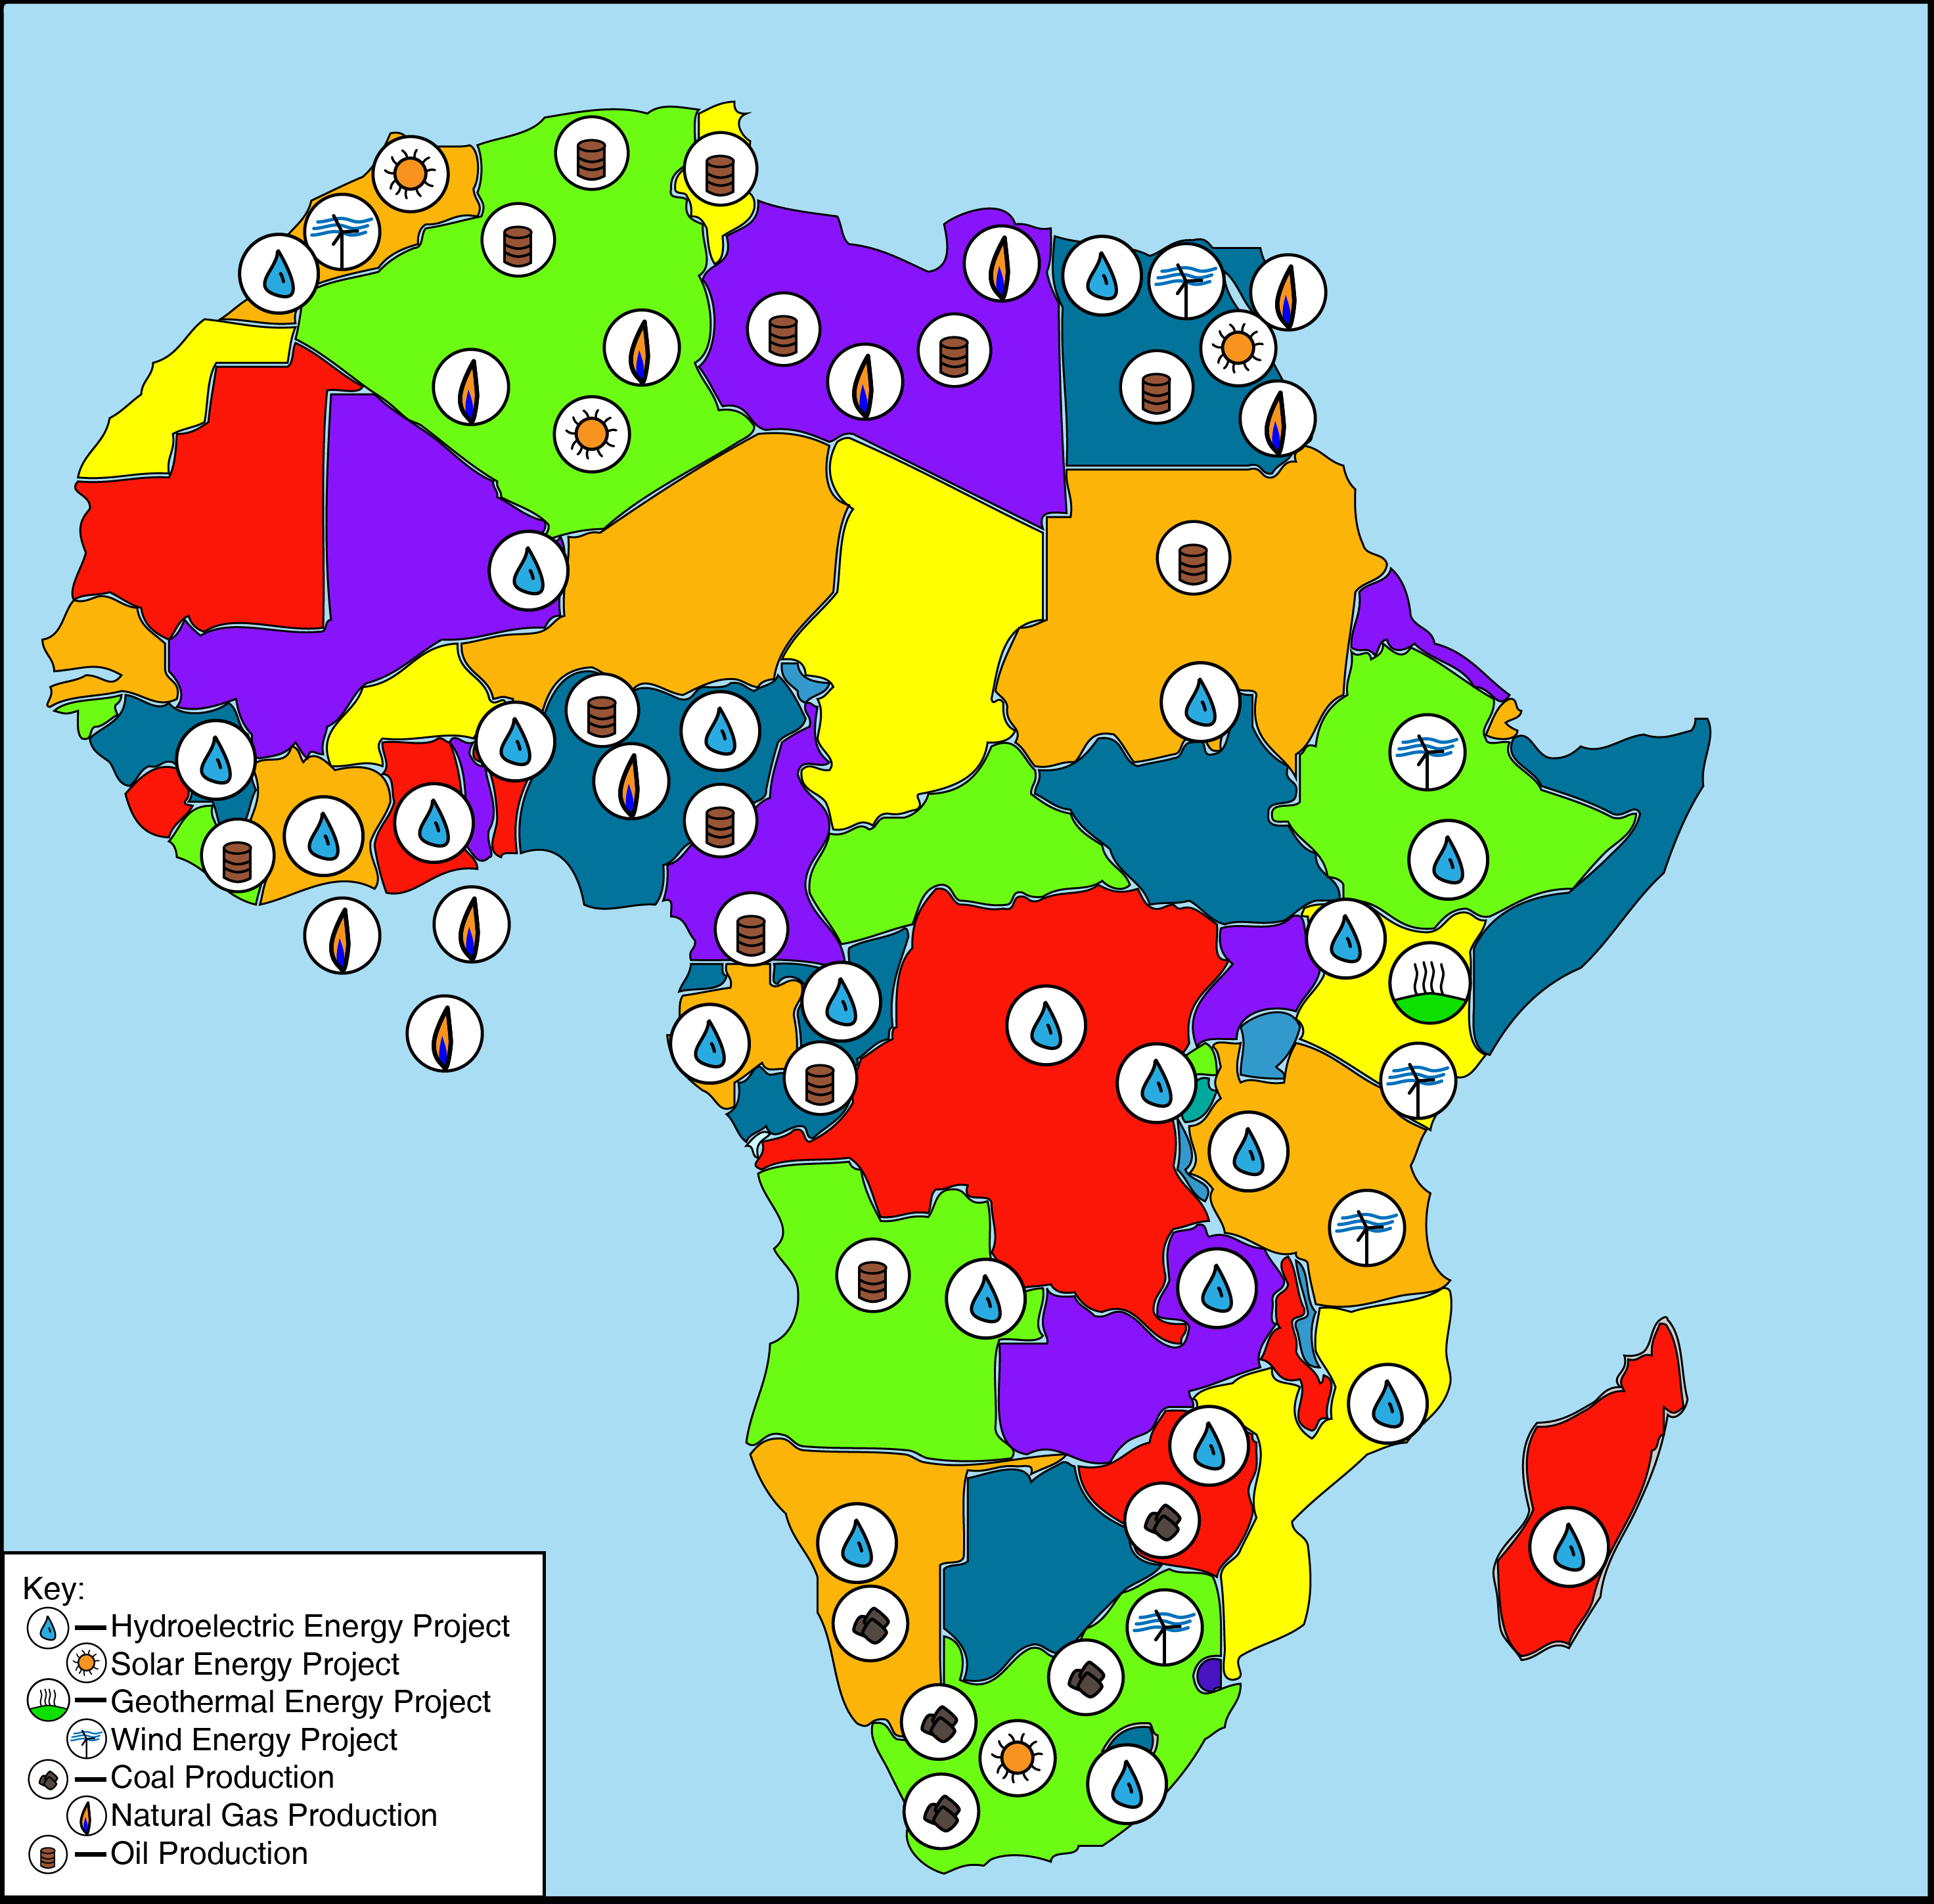
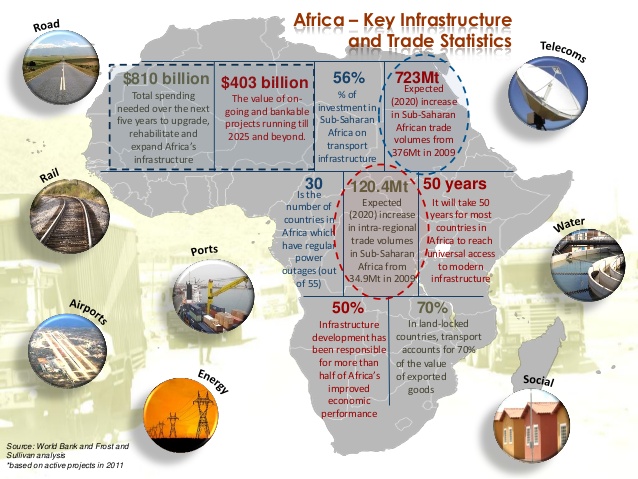
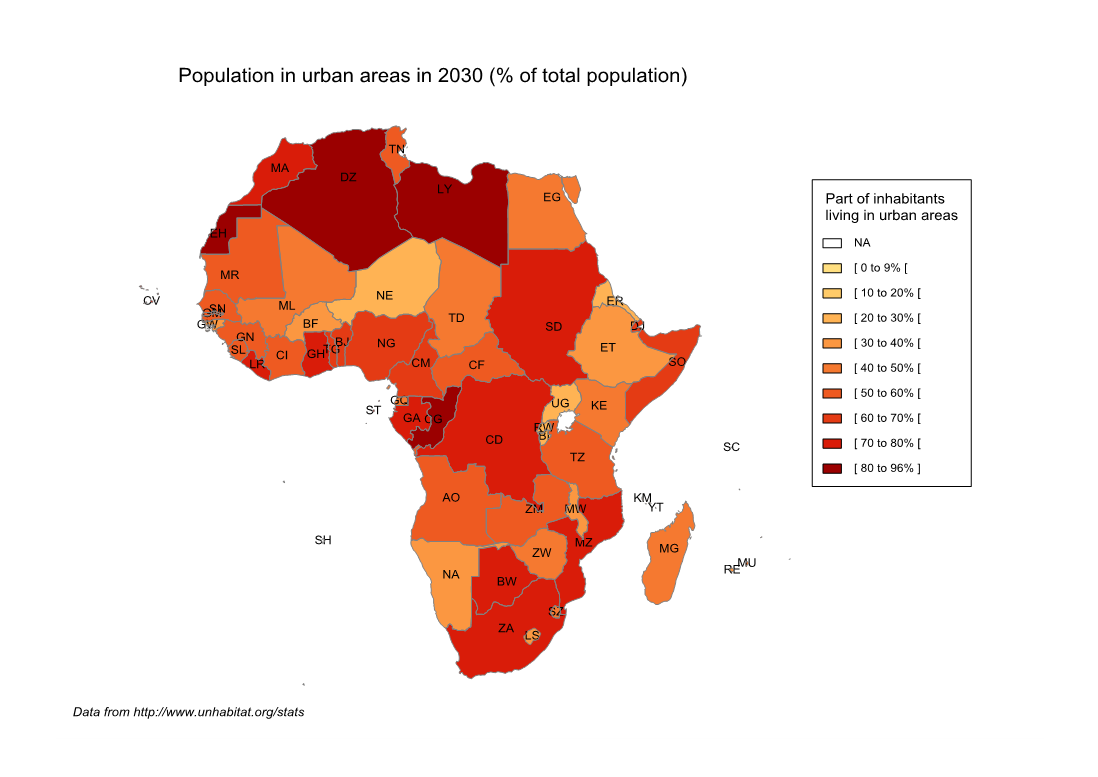
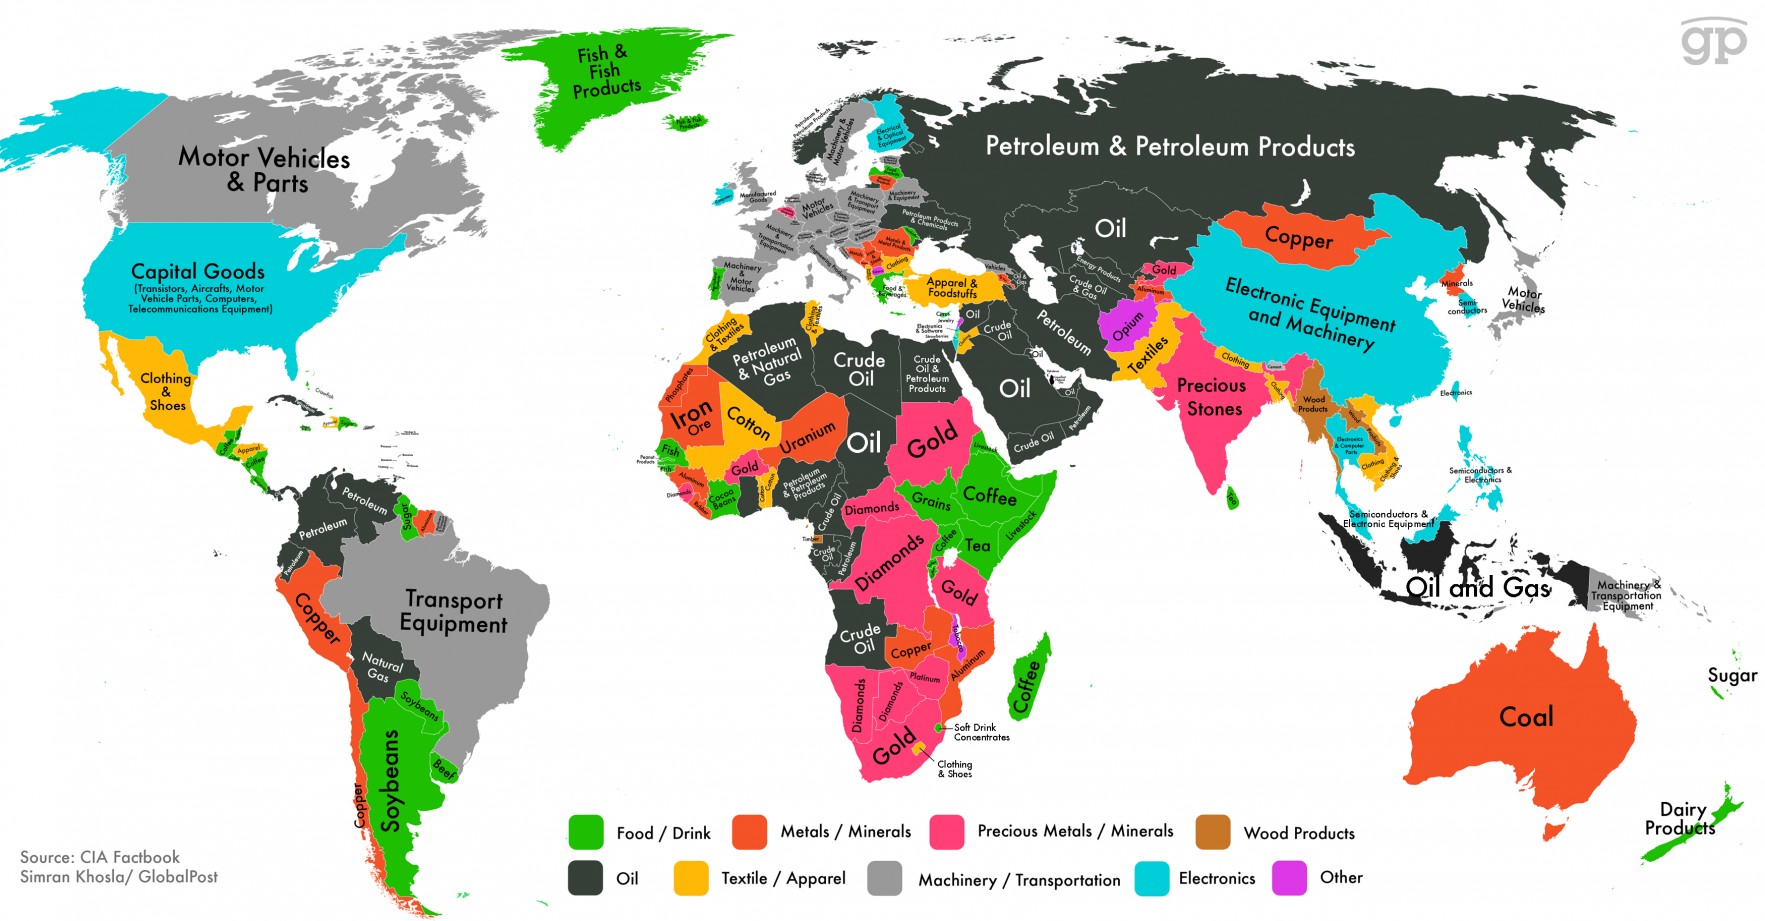
L’Infographie (Infographics) utilise des représentations graphiques visuelles d’informations, de savoir et de données statistiques. Elle permet de représenter des informations complexes rapidement et clairement. Ces diagrammes visuels concernent l’économie africaine.

China-Africa-trade-2012

china-direct-invest-africa

Energy_Resources_and_Projects_in_Continental_Africa,_snapshot_2012

facilitating-trade-across-africa-with-ports-infrastructure-development

urban-population2030

world-commodities-map

Africa_ethnic_groups_1996

africa_in_perspective_map

africa-commodities-map

africa-Drinking_Water_Accessibility

africa-flags

africa-foreign-investment

africa-happiest-countries-2013

africa-largest-populations

africa-lowest-hdi-ranking-countries

african_undersea_cables_map

africa-natural-resources

african-CO2-emissions

africa-need-electricity

african-facebook-users-2013

african-footballers-earnings

african-internet-censorship

african-mobile-subscription-2013

africa-Religion_distribution

africa-renewable-energy

africa-rising

africa-telecom

Africa-telecom-Investment Map-2012

africa-undersea-cables

brics-facebook-users

China Infrastructure Projects

China-Africa 5-Jan2010

China-Africa-Jan2010-1

world-commodities-map

african_undersea_cables_map

african-CO2-emissions

african-facebook-users-2013

african-footballers-earnings

african-internet-censorship

african-mobile-subscription-2013

africa-undersea-cables

brics-facebook-users

China Infrastructure Projects

China-Africa 5-Jan2010

China-Africa-Jan2010-1

China-Africa-trade-2012

Energy_Resources_and_Projects_in_Continental_Africa,_snapshot_2012

facilitating-trade-across-africa-with-ports-infrastructure-development

china-direct-invest-africa

urban-population2030